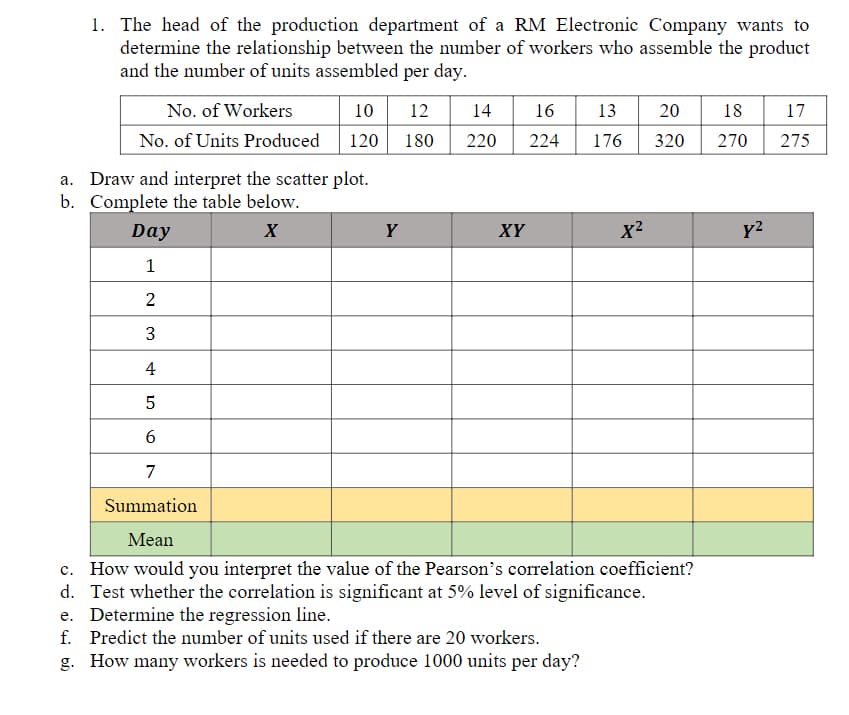
The head of the production department of a RM Electronic Company wants to determine the relationship between the number of workers who assemble the product and the number of units assembled per day. d.Test whether the correlation is significant at 5% level of significance. e.Determine the regression line. f.Predict the number of units used if there are 20 workers.
The head of the production department of a RM Electronic Company wants to determine the relationship between the number of workers who assemble the product and the number of units assembled per day. d.Test whether the correlation is significant at 5% level of significance. e.Determine the regression line. f.Predict the number of units used if there are 20 workers.
Glencoe Algebra 1, Student Edition, 9780079039897, 0079039898, 2018
18th Edition
ISBN:9780079039897
Author:Carter
Publisher:Carter
Chapter4: Equations Of Linear Functions
Section4.5: Correlation And Causation
Problem 24PFA
Related questions
Question
1.The head of the production department of a RM Electronic Company wants to determine the relationship between the number of workers who assemble the product and the number of units assembled per day.
d.Test whether the correlation is significant at 5% level of significance.
e.Determine the regression line.
f.Predict the number of units used if there are 20 workers.
g.How many workers is needed to produce 1000 units per day?

Transcribed Image Text:1. The head of the production department of a RM Electronic Company wants to
determine the relationship between the number of workers who assemble the product
and the number of units assembled per day.
No. of Workers
10
No. of Units Produced 120 180
a. Draw and interpret the scatter plot.
b. Complete the table below.
X
12 14
220
Y
Day
1
2
3
4
5
6
7
Summation
Mean
c. How would you interpret the value of the Pearson's correlation coefficient?
d. Test whether the correlation is significant at 5% level of significance.
e. Determine the regression line.
f. Predict the number of units used if there are 20 workers.
g. How many workers is needed to produce 1000 units per day?
16 13 20 18 17
224 176
320
270 275
XY
X²
y²
Expert Solution
This question has been solved!
Explore an expertly crafted, step-by-step solution for a thorough understanding of key concepts.
Step by step
Solved in 4 steps with 1 images

Recommended textbooks for you

Glencoe Algebra 1, Student Edition, 9780079039897…
Algebra
ISBN:
9780079039897
Author:
Carter
Publisher:
McGraw Hill

Glencoe Algebra 1, Student Edition, 9780079039897…
Algebra
ISBN:
9780079039897
Author:
Carter
Publisher:
McGraw Hill