"Trt" "Calories" "1" 1 435.16 "2" 1 338.99 "3" 1 488.73 "4" 1 590.28 "5" 1 582.59 "6" 1 635.21 "7" 1 249.86 "8" 1 441.66 "9" 1 572.43 "10" 1 357.78 "11" 1 396.79 "12" 1 298.38 "13" 1 282.99 "14" 1 368.51 "15" 1 388.59 "16" 1 256.32 "17" 1 408.82 "18" 1 424.94 "19" 1 477.96 "20" 1 428.74 "21" 1 432.52 "22" 1 428.27 "23" 1 596.79 "24" 1 456.3 "25" 1 446.38 "26" 2 414.61 "27" 2 503.46 "28" 2 425.22 "29" 2 288.77 "30" 2 184 "31" 2 299.73 "32" 2 350.65 "33" 2 394.94 "34" 2 261.55 "35" 2 295.28 "36" 2 139.69 "37" 2 462.78 "38" 2 179.59 "39" 2 301.75 "40" 2 436.58 "41" 2 371.39. "42" 2 469.02 "43" 2 378.09 "44" 2 287.31 "45" 2 448.55 "46" 2 332.64 "47" 2 403.98 3d. (Data calories.txt) Refer to the caloric intake description and your answers to the previous question. What is the p-value? Do not round numbers for intermediate calculations. Round your final answer to three decimals. 3e. (Data calories.txt) Refer to the caloric intake description and your answers to the previous question. We are interested in determining whether the difference in treatments is real or is simply due to chance variation. Whether appropriate or not, you are asked to perform a Welch-t test using these data. What is your conclusion? O The difference in treatments is due to chance variation. The difference in treatments is real. O The results are inconclusive 3a. (Data calories.txt) Refer to the caloric intake description. We are interested in determining whether the difference in treatments is real or is simply due to chance variation. Answer the following questions: (a) Do the sample for the first treatment follow the normal curve [Select] Yes, the histogram follow exactly the normal curve The histogram doesn't follow the normal curve exactly, but (b) Do the sample for the second group follow the normal curve? No, the histogram is clearly very far from the normal curve None of these answers seem appropriate. Please see my R (c) What is the experimental unit? [Select] (d) How many populations? [Select] (e) How many measurements per experimental unit? [Select] (f) Is this a one-sample or two-sample problem? [Select] 3b. (Data calories.txt) Refer to the caloric intake description and your answers to the previous question. We are interested in determining whether the difference in treatments is real or is simply due to chance variation. Assume that the population(s) follow(s) the normal curve, but obviously, we only have information about the sample. Select the most appropriate option from the ones listed below. O One-sample t test O (Welch) two-sample t-test Chi-square test for goodness-of-fit O Chi-square test for independence O None of the above are appropriate 3c. (Data calories.txt) Refer to the caloric intake description and your answers to the previous question. We are interested in determining whether the difference in treatments is real or is simply due to chance variation. Whether appropriate or not, you are asked to perform a Welch-t test using these data. What is the test statistic? Do not round numbers for intermediate calculations. Round your final answer to three decimals.
"Trt" "Calories" "1" 1 435.16 "2" 1 338.99 "3" 1 488.73 "4" 1 590.28 "5" 1 582.59 "6" 1 635.21 "7" 1 249.86 "8" 1 441.66 "9" 1 572.43 "10" 1 357.78 "11" 1 396.79 "12" 1 298.38 "13" 1 282.99 "14" 1 368.51 "15" 1 388.59 "16" 1 256.32 "17" 1 408.82 "18" 1 424.94 "19" 1 477.96 "20" 1 428.74 "21" 1 432.52 "22" 1 428.27 "23" 1 596.79 "24" 1 456.3 "25" 1 446.38 "26" 2 414.61 "27" 2 503.46 "28" 2 425.22 "29" 2 288.77 "30" 2 184 "31" 2 299.73 "32" 2 350.65 "33" 2 394.94 "34" 2 261.55 "35" 2 295.28 "36" 2 139.69 "37" 2 462.78 "38" 2 179.59 "39" 2 301.75 "40" 2 436.58 "41" 2 371.39. "42" 2 469.02 "43" 2 378.09 "44" 2 287.31 "45" 2 448.55 "46" 2 332.64 "47" 2 403.98 3d. (Data calories.txt) Refer to the caloric intake description and your answers to the previous question. What is the p-value? Do not round numbers for intermediate calculations. Round your final answer to three decimals. 3e. (Data calories.txt) Refer to the caloric intake description and your answers to the previous question. We are interested in determining whether the difference in treatments is real or is simply due to chance variation. Whether appropriate or not, you are asked to perform a Welch-t test using these data. What is your conclusion? O The difference in treatments is due to chance variation. The difference in treatments is real. O The results are inconclusive 3a. (Data calories.txt) Refer to the caloric intake description. We are interested in determining whether the difference in treatments is real or is simply due to chance variation. Answer the following questions: (a) Do the sample for the first treatment follow the normal curve [Select] Yes, the histogram follow exactly the normal curve The histogram doesn't follow the normal curve exactly, but (b) Do the sample for the second group follow the normal curve? No, the histogram is clearly very far from the normal curve None of these answers seem appropriate. Please see my R (c) What is the experimental unit? [Select] (d) How many populations? [Select] (e) How many measurements per experimental unit? [Select] (f) Is this a one-sample or two-sample problem? [Select] 3b. (Data calories.txt) Refer to the caloric intake description and your answers to the previous question. We are interested in determining whether the difference in treatments is real or is simply due to chance variation. Assume that the population(s) follow(s) the normal curve, but obviously, we only have information about the sample. Select the most appropriate option from the ones listed below. O One-sample t test O (Welch) two-sample t-test Chi-square test for goodness-of-fit O Chi-square test for independence O None of the above are appropriate 3c. (Data calories.txt) Refer to the caloric intake description and your answers to the previous question. We are interested in determining whether the difference in treatments is real or is simply due to chance variation. Whether appropriate or not, you are asked to perform a Welch-t test using these data. What is the test statistic? Do not round numbers for intermediate calculations. Round your final answer to three decimals.

Glencoe Algebra 1, Student Edition, 9780079039897, 0079039898, 2018
18th Edition
ISBN:9780079039897
Author:Carter
Publisher:Carter
Chapter10: Statistics
Section10.4: Distributions Of Data
Problem 19PFA

Related questions
Question
part D E
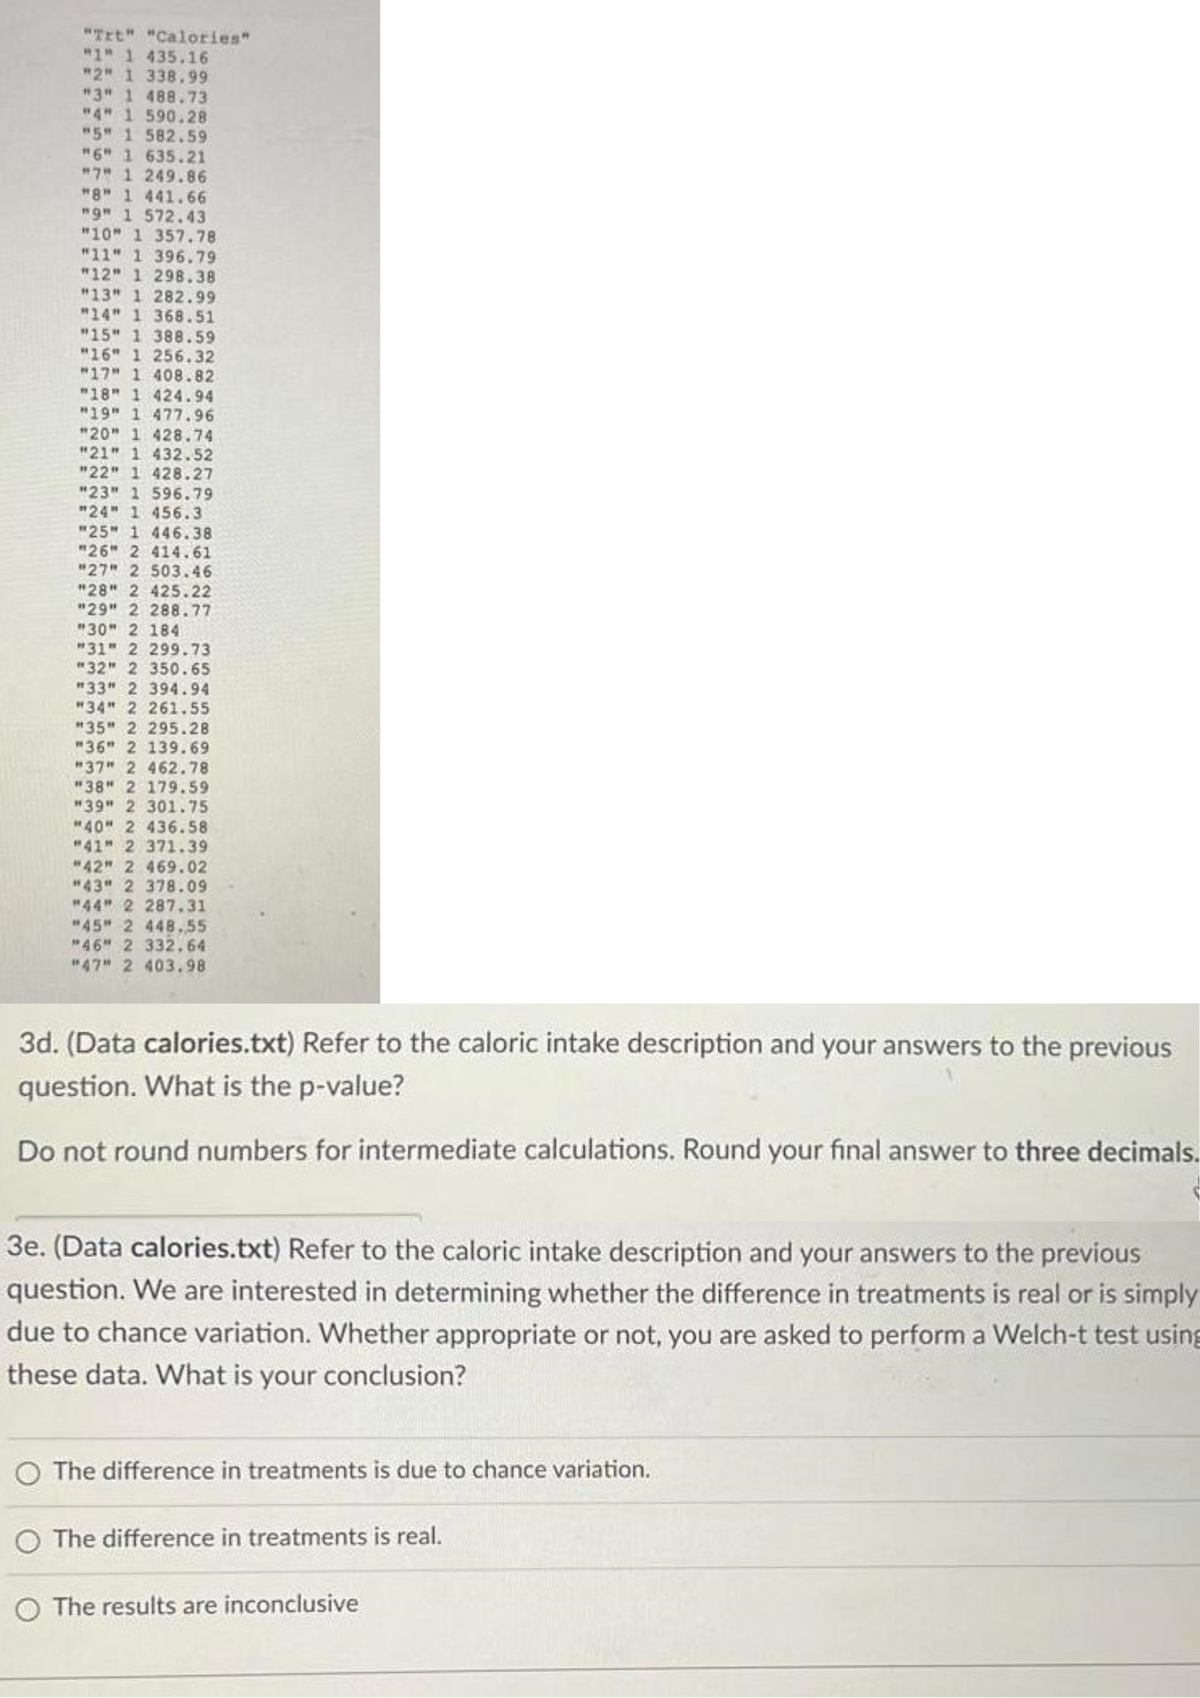
Transcribed Image Text:"Trt" "Calories"
"1" 1 435.16
"2" 1 338.99
"3" 1 488.73
"4" 1 590.28
"5" 1 582.59
"6" 1 635.21
"7" 1 249.86
"8" 1 441.66
"9" 1 572.43
"10" 1 357.78
"11" 1 396.79
"12" 1 298.38
"13" 1 282.99
"14" 1 368.51
"15" 1 388.59
"16" 1 256.32
"17" 1 408.82
"18" 1 424.94
"19" 1 477.96
"20" 1 428.74
"21" 1 432.52
"22" 1 428.27
"23" 1 596.79
"24" 1 456.3
"25" 1 446.38
"26" 2 414.61
"27" 2 503.46
"28" 2 425.22
"29" 2 288.77
"30" 2 184
"31" 2 299.73
"32" 2 350.65
"33" 2 394.94
"34" 2 261.55
"35" 2 295.28
"36" 2 139.69
"37" 2 462.78
"38" 2 179.59
"39" 2 301.75
"40" 2 436.58
"41" 2 371.39.
"42" 2 469.02
"43" 2 378.09
"44" 2 287.31
"45" 2 448.55
"46" 2 332.64
"47" 2 403.98
3d. (Data calories.txt) Refer to the caloric intake description and your answers to the previous
question. What is the p-value?
Do not round numbers for intermediate calculations. Round your final answer to three decimals.
3e. (Data calories.txt) Refer to the caloric intake description and your answers to the previous
question. We are interested in determining whether the difference in treatments is real or is simply
due to chance variation. Whether appropriate or not, you are asked to perform a Welch-t test using
these data. What is your conclusion?
O The difference in treatments is due to chance variation.
The difference in treatments is real.
O The results are inconclusive
![3a. (Data calories.txt) Refer to the caloric intake description. We are interested in determining
whether the difference in treatments is real or is simply due to chance variation. Answer the
following questions:
(a) Do the sample for the first treatment follow the normal curve [Select]
Yes, the histogram follow exactly the normal curve
The histogram doesn't follow the normal curve exactly, but
(b) Do the sample for the second group follow the normal curve? No, the histogram is clearly very far from the normal curve
None of these answers seem appropriate. Please see my R
(c) What is the experimental unit? [Select]
(d) How many populations? [Select]
(e) How many measurements per experimental unit? [Select]
(f) Is this a one-sample or two-sample problem? [Select]
3b. (Data calories.txt) Refer to the caloric intake description and your answers to the previous
question. We are interested in determining whether the difference in treatments is real or is simply
due to chance variation. Assume that the population(s) follow(s) the normal curve, but obviously,
we only have information about the sample. Select the most appropriate option from the ones
listed below.
O One-sample t test
O (Welch) two-sample t-test
Chi-square test for goodness-of-fit
O Chi-square test for independence
O None of the above are appropriate
3c. (Data calories.txt) Refer to the caloric intake description and your answers to the previous
question. We are interested in determining whether the difference in treatments is real or is simply
due to chance variation. Whether appropriate or not, you are asked to perform a Welch-t test using
these data. What is the test statistic?
Do not round numbers for intermediate calculations. Round your final answer to three decimals.](/v2/_next/image?url=https%3A%2F%2Fcontent.bartleby.com%2Fqna-images%2Fquestion%2Fd3cf2f30-2e38-482e-ac81-eb0210bb852b%2Fb1eb3e57-ac17-43ea-bd0f-25ffcdc1e8b4%2Fgrbjhss_processed.png&w=3840&q=75)
Transcribed Image Text:3a. (Data calories.txt) Refer to the caloric intake description. We are interested in determining
whether the difference in treatments is real or is simply due to chance variation. Answer the
following questions:
(a) Do the sample for the first treatment follow the normal curve [Select]
Yes, the histogram follow exactly the normal curve
The histogram doesn't follow the normal curve exactly, but
(b) Do the sample for the second group follow the normal curve? No, the histogram is clearly very far from the normal curve
None of these answers seem appropriate. Please see my R
(c) What is the experimental unit? [Select]
(d) How many populations? [Select]
(e) How many measurements per experimental unit? [Select]
(f) Is this a one-sample or two-sample problem? [Select]
3b. (Data calories.txt) Refer to the caloric intake description and your answers to the previous
question. We are interested in determining whether the difference in treatments is real or is simply
due to chance variation. Assume that the population(s) follow(s) the normal curve, but obviously,
we only have information about the sample. Select the most appropriate option from the ones
listed below.
O One-sample t test
O (Welch) two-sample t-test
Chi-square test for goodness-of-fit
O Chi-square test for independence
O None of the above are appropriate
3c. (Data calories.txt) Refer to the caloric intake description and your answers to the previous
question. We are interested in determining whether the difference in treatments is real or is simply
due to chance variation. Whether appropriate or not, you are asked to perform a Welch-t test using
these data. What is the test statistic?
Do not round numbers for intermediate calculations. Round your final answer to three decimals.
Expert Solution
This question has been solved!
Explore an expertly crafted, step-by-step solution for a thorough understanding of key concepts.

This is a popular solution!

Trending now
This is a popular solution!

Step by step
Solved in 3 steps

Recommended textbooks for you
Glencoe Algebra 1, Student Edition, 9780079039897…
Algebra
ISBN:
9780079039897
Author:
Carter
Publisher:
McGraw Hill
Glencoe Algebra 1, Student Edition, 9780079039897…
Algebra
ISBN:
9780079039897
Author:
Carter
Publisher:
McGraw Hill