The height, h, of two balls, in metres, after t seconds are shown in the graph below. b↑ 20 16 12 8 a) Determine the approximate time interval for when the two balls were less than 4 m apart. b) When was the difference between the heights of the balls the greatest?
The height, h, of two balls, in metres, after t seconds are shown in the graph below. b↑ 20 16 12 8 a) Determine the approximate time interval for when the two balls were less than 4 m apart. b) When was the difference between the heights of the balls the greatest?

Chapter1: The Study Of Motion
Section: Chapter Questions
Problem 1MIO: Consider Concept Map 1,1, which provides an overview of motion. Review Sections 1,2 and 1,3 and make...

Related questions

Question
Pls help ASAP and pls make sure the answer has all steps and calculations.
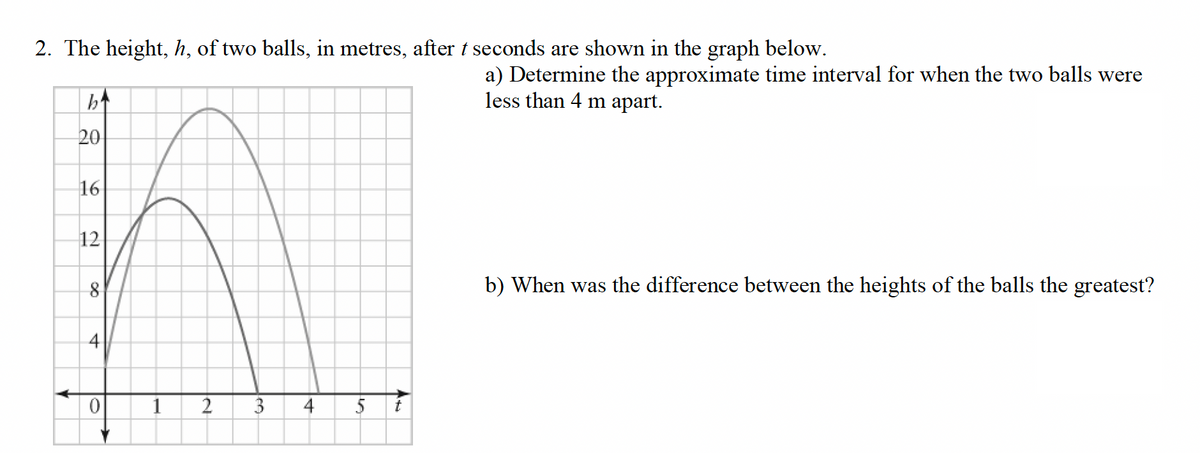
Transcribed Image Text:2. The height, h, of two balls, in metres, after t seconds are shown in the graph below.
b↑
20
16
12
8
0
1
2
3
10
4 5
t
a) Determine the approximate time interval for when the two balls were
less than 4 m apart.
b) When was the difference between the heights of the balls the greatest?
Expert Solution
This question has been solved!
Explore an expertly crafted, step-by-step solution for a thorough understanding of key concepts.

Step by step
Solved in 3 steps with 1 images

Knowledge Booster


Learn more about
Need a deep-dive on the concept behind this application? Look no further. Learn more about this topic, physics and related others by exploring similar questions and additional content below.Recommended textbooks for you