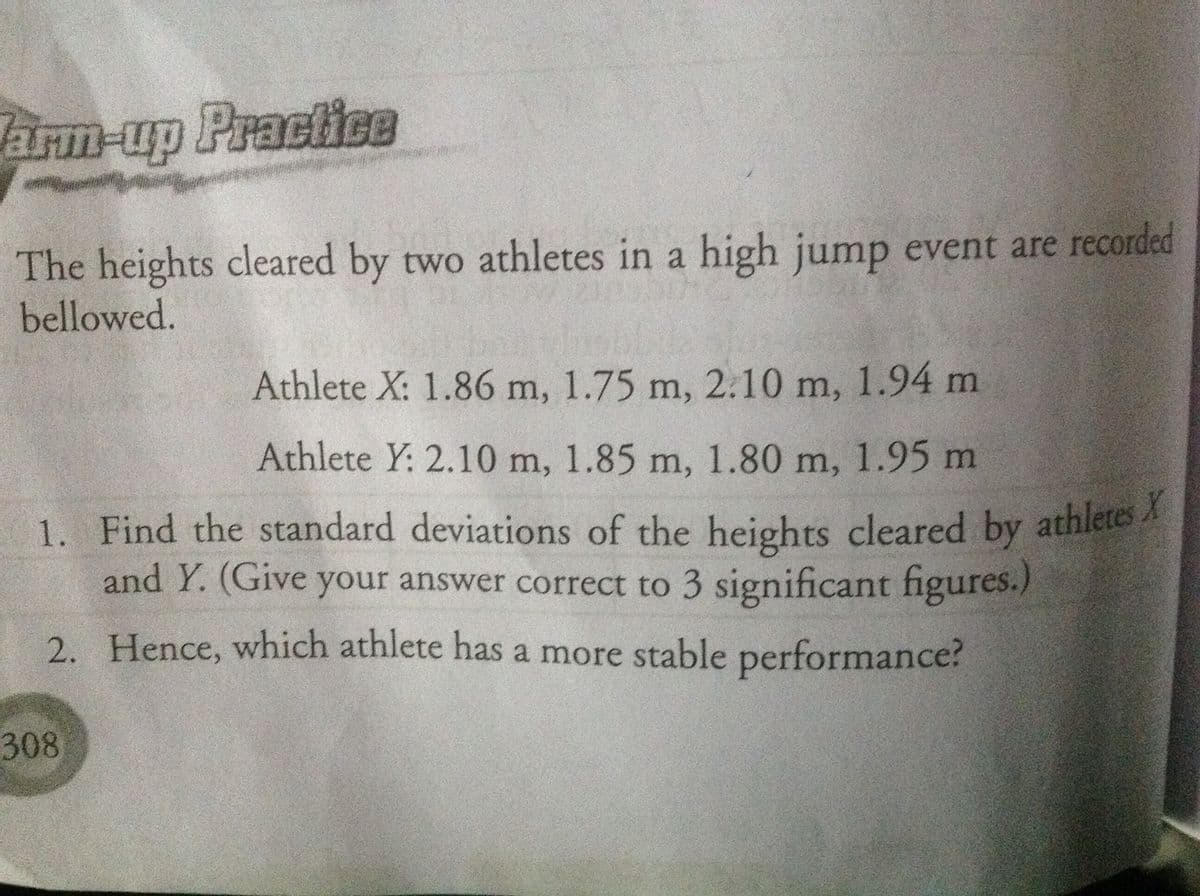
The heights cleared by two athletes in a high jump event are recorded bellowed. Athlete X: 1.86 m, 1.75 m, 2.10 m, 1.94 m Athlete Y: 2.10 m, 1.85 m, 1.80 m, 1.95 m 1. Find the standard deviations of the heights cleared by athletes A and Y. (Give your answer correct to 3 significant figures.) 2. Hence, which athlete has a more stable performance?
The heights cleared by two athletes in a high jump event are recorded bellowed. Athlete X: 1.86 m, 1.75 m, 2.10 m, 1.94 m Athlete Y: 2.10 m, 1.85 m, 1.80 m, 1.95 m 1. Find the standard deviations of the heights cleared by athletes A and Y. (Give your answer correct to 3 significant figures.) 2. Hence, which athlete has a more stable performance?
Glencoe Algebra 1, Student Edition, 9780079039897, 0079039898, 2018
18th Edition
ISBN:9780079039897
Author:Carter
Publisher:Carter
Chapter10: Statistics
Section10.4: Distributions Of Data
Problem 19PFA
Related questions
Question
100%

Transcribed Image Text:1. Find the standard deviations of the heights cleared by athletes X
arn-up Practice
The heights cleared by two athletes in a high jump event are recorded
bellowed.
Athlete X: 1.86 m, 1.75 m, 2.10 m, 1.94 m
Athlete Y: 2.10 m, 1.85 m, 1.80 m, 1.95 m
1. Find the standard deviations of the heights cleared by athletesA
and Y. (Give your answer correct to 3 significant figures.)
2. Hence, which athlete has a more stable performance?
308

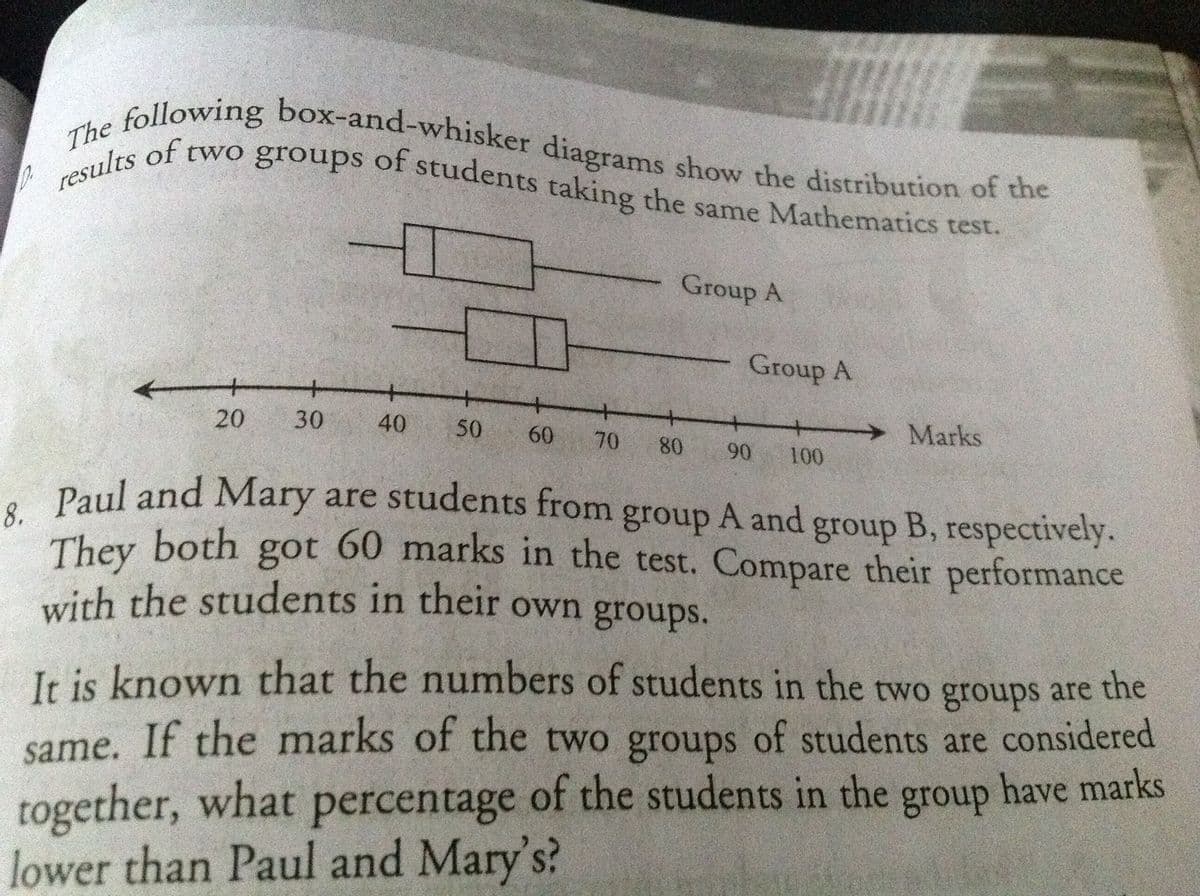
Transcribed Image Text:results of two groups of students taking the same Mathematics test.
The following box-and-whisker diagrams show the distribution of the
The of two groups of students taking the same Mathematics test.
Group A
Group A
+
+.
Marks
20
30
40
50
60
70
80
90
100
Paul and Mary are students from group A and group B, respectively.
They both got 60 marks in the test. Compare their performance
with the students in their own groups.
Ir is known that the numbers of students in the two groups are the
together, what percentage of the students in the group have marks
lower than Paul and Mary's?
same. If the marks of the two groups of students are considered
Expert Solution
This question has been solved!
Explore an expertly crafted, step-by-step solution for a thorough understanding of key concepts.
Step by step
Solved in 4 steps

Knowledge Booster
Learn more about
Need a deep-dive on the concept behind this application? Look no further. Learn more about this topic, statistics and related others by exploring similar questions and additional content below.Recommended textbooks for you

Glencoe Algebra 1, Student Edition, 9780079039897…
Algebra
ISBN:
9780079039897
Author:
Carter
Publisher:
McGraw Hill

Glencoe Algebra 1, Student Edition, 9780079039897…
Algebra
ISBN:
9780079039897
Author:
Carter
Publisher:
McGraw Hill