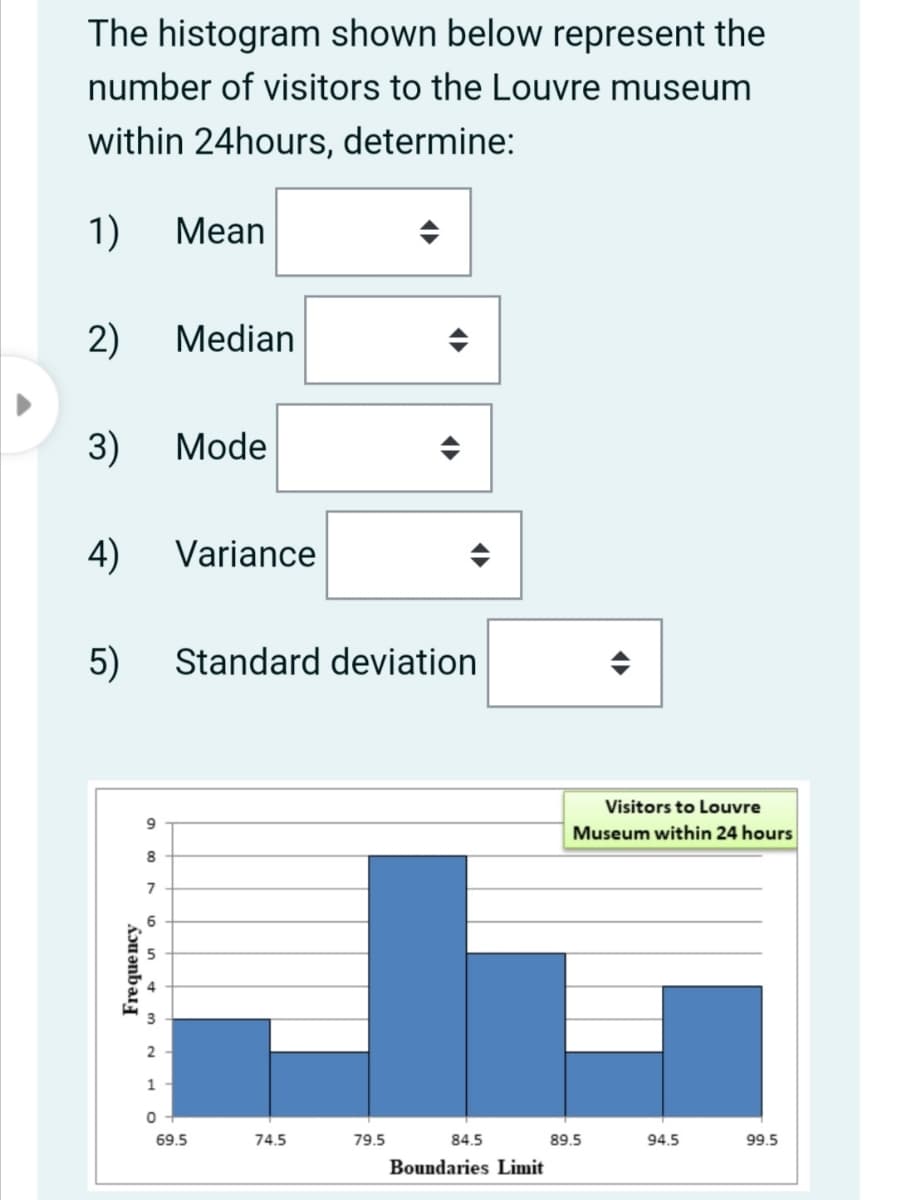
The histogram shown below represent the number of visitors to the Louvre museum within 24hours, determine: 1) Mean 2) Median 3) Mode 4) Variance 5) Standard deviation Visitors to Louvre Museum within 24 hours 6 69.5 74.5 79.5 84.5 89.5 94.5 99.5 Boundaries Limit
The histogram shown below represent the number of visitors to the Louvre museum within 24hours, determine: 1) Mean 2) Median 3) Mode 4) Variance 5) Standard deviation Visitors to Louvre Museum within 24 hours 6 69.5 74.5 79.5 84.5 89.5 94.5 99.5 Boundaries Limit

College Algebra (MindTap Course List)
12th Edition
ISBN:9781305652231
Author:R. David Gustafson, Jeff Hughes
Publisher:R. David Gustafson, Jeff Hughes
Chapter8: Sequences, Series, And Probability
Section8.7: Probability
Problem 58E: What is meant by the sample space of an experiment?

Related questions
Topic Video
Question
Transcribed Image Text:The histogram shown below represent the
number of visitors to the Louvre museum
within 24hours, determine:
1)
Mean
2)
Median
3)
Mode
4)
Variance
5)
Standard deviation
Visitors to Louvre
9
Museum within 24 hours
8.
7
2
1
69.5
74.5
79.5
84.5
89.5
94.5
99.5
Boundaries Limit
Frequency
Expert Solution
This question has been solved!
Explore an expertly crafted, step-by-step solution for a thorough understanding of key concepts.

Step by step
Solved in 2 steps

Knowledge Booster


Learn more about
Need a deep-dive on the concept behind this application? Look no further. Learn more about this topic, statistics and related others by exploring similar questions and additional content below.Recommended textbooks for you
College Algebra (MindTap Course List)
Algebra
ISBN:
9781305652231
Author:
R. David Gustafson, Jeff Hughes
Publisher:
Cengage Learning
College Algebra (MindTap Course List)
Algebra
ISBN:
9781305652231
Author:
R. David Gustafson, Jeff Hughes
Publisher:
Cengage Learning