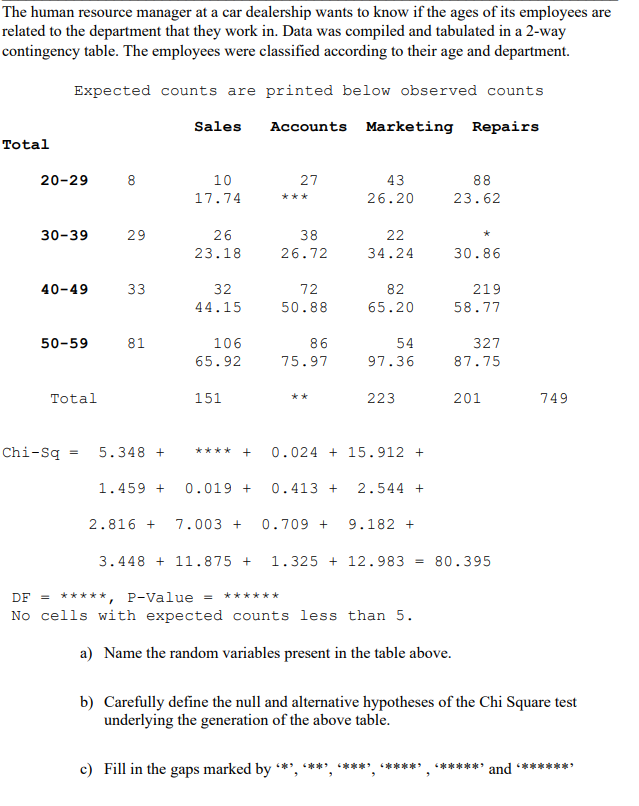
The human resource manager at a car dealership wants to know if the ages of its employees are related to the department that they work in. Data was compiled and tabulated in a 2-way contingency table. The employees were classified according to their age and department.
The human resource manager at a car dealership wants to know if the ages of its employees are related to the department that they work in. Data was compiled and tabulated in a 2-way contingency table. The employees were classified according to their age and department.

Glencoe Algebra 1, Student Edition, 9780079039897, 0079039898, 2018
18th Edition
ISBN:9780079039897
Author:Carter
Publisher:Carter
Chapter10: Statistics
Section10.3: Measures Of Spread
Problem 1GP

Related questions
Question
Need help with C.
Transcribed Image Text:The human resource manager at a car dealership wants to know if the ages of its employees are
related to the department that they work in. Data was compiled and tabulated in a 2-way
contingency table. The employees were classified according to their age and department.
Expected counts are printed below observed counts
Sales
Accounts Marketing Repairs
Total
20-29
8
10
27
43
88
17.74
23.62
***
26.20
30-39
29
26
38
22
23.18
26.72
34.24
30.86
40-49
33
32
72
82
219
44.15
50.88
65.20
58.77
50-59
81
106
86
54
327
65.92
75.97
97.36
87.75
Total
151
223
201
749
Chi-Sq
5.348 +
**** +
0.024 + 15.912 +
1.459 +
0.019 +
0.413 +
2.544 +
2.816 +
7.003 +
0.709 +
9.182 +
3.448 + 11.875 +
1.325 + 12.983 = 80.395
*****, P-Value = ******
No cells with expected counts less than 5.
DF =
a) Name the random variables present in the table above.
b) Carefully define the null and alternative hypotheses of the Chi Square test
underlying the generation of the above table.
c) Fill in the gaps marked by ***
****,
*****
pue .******
Expert Solution
This question has been solved!
Explore an expertly crafted, step-by-step solution for a thorough understanding of key concepts.

Step by step
Solved in 3 steps with 3 images

Recommended textbooks for you
Glencoe Algebra 1, Student Edition, 9780079039897…
Algebra
ISBN:
9780079039897
Author:
Carter
Publisher:
McGraw Hill


College Algebra (MindTap Course List)
Algebra
ISBN:
9781305652231
Author:
R. David Gustafson, Jeff Hughes
Publisher:
Cengage Learning
Glencoe Algebra 1, Student Edition, 9780079039897…
Algebra
ISBN:
9780079039897
Author:
Carter
Publisher:
McGraw Hill
College Algebra (MindTap Course List)
Algebra
ISBN:
9781305652231
Author:
R. David Gustafson, Jeff Hughes
Publisher:
Cengage Learning