The human resources manager of a certain company is concerned about the level of employee absenteeism. He identified three factors which he believes are the most significant contributors to employee absenteeism at the company: X = the length of job tenure of an employee (measured in months) X2 = the level of job-satisfaction (measured by an index from 0 to 75) www X3 = the level of an employee's commitment (measured by an index from 0 to 70) www random sample of 20 employee records selected and the model was E(v) = Bo + B+ Bx + B3x3 was fitted to the sample data. The results are given in the SAS printout on page 7. Using the values of the standardized residuals on the printout how to I identify any outliers.
The human resources manager of a certain company is concerned about the level of employee absenteeism. He identified three factors which he believes are the most significant contributors to employee absenteeism at the company: X = the length of job tenure of an employee (measured in months) X2 = the level of job-satisfaction (measured by an index from 0 to 75) www X3 = the level of an employee's commitment (measured by an index from 0 to 70) www random sample of 20 employee records selected and the model was E(v) = Bo + B+ Bx + B3x3 was fitted to the sample data. The results are given in the SAS printout on page 7. Using the values of the standardized residuals on the printout how to I identify any outliers.

Functions and Change: A Modeling Approach to College Algebra (MindTap Course List)
6th Edition
ISBN:9781337111348
Author:Bruce Crauder, Benny Evans, Alan Noell
Publisher:Bruce Crauder, Benny Evans, Alan Noell
Chapter5: A Survey Of Other Common Functions
Section5.3: Modeling Data With Power Functions
Problem 6E: Urban Travel Times Population of cities and driving times are related, as shown in the accompanying...

Related questions
Topic Video
Question
Hallo...please help
Transcribed Image Text:70% 08:13
4G
Exam preps - Saved
目
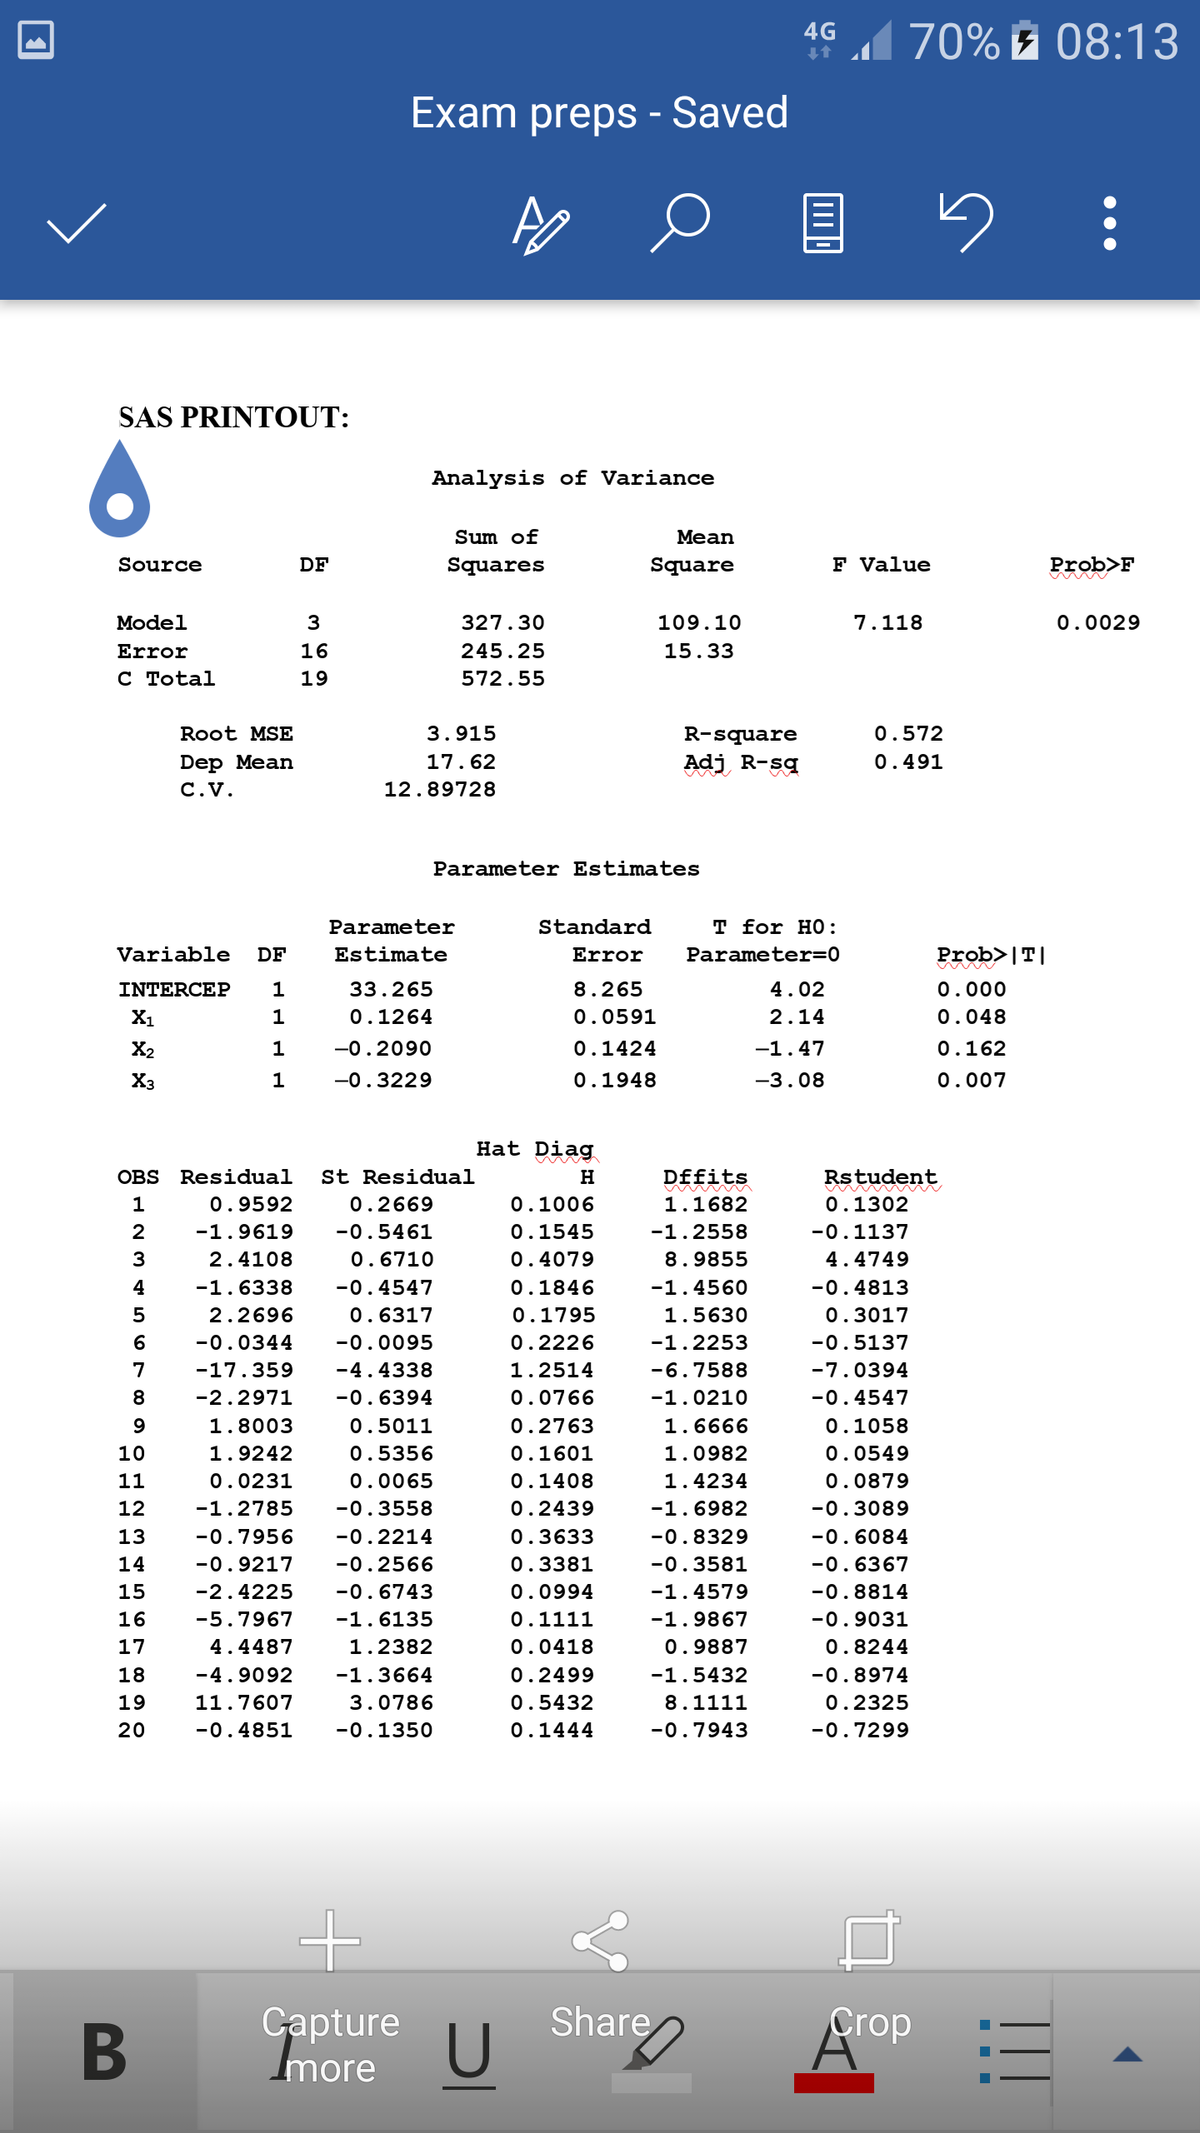
SAS PRINTOUT:
Analysis of Variance
Sum of
Mean
Source
DF
Squares
Square
F Value
Prob>F
M
Model
3
327.30
109.10
7.118
0.0029
Error
16
245.25
15.33
C Total
19
572.55
Root MSE
3.915
R-square
0.572
Dep Mean
17.62
Adj R-sq
0.491
C.V.
12.89728
Parameter Estimates
Parameter
Standard
т for HO:
Variable
DF
Estimate
Error
Parameter=0
Prob>|T|
INTERCEP
1
33.265
8.265
4.02
0.000
X1
0.1264
0.0591
2.14
0.048
X2
1
-0.2090
0.1424
-1.47
0.162
X3
-0.3229
0.1948
-3.08
0.007
Hat Diag
OBS Residual
St Residual
H
Dffits
Rstudent
1
0.9592
0.2669
0.1006
1.1682
0.1302
2
-1.9619
-0.5461
0.1545
-1.2558
-0.1137
2.4108
0.6710
0.4079
8.9855
4.4749
4
-1.6338
-0.4547
0.1846
-1.4560
-0.4813
2.2696
0.6317
0.1795
1.5630
0.3017
6
-0.0344
-0.0095
0.2226
-1.2253
-0.5137
7
-17.359
-4.4338
1.2514
-6.7588
-7.0394
8
-2.2971
-0.6394
0.0766
-1.0210
-0.4547
1.8003
0.5011
0.2763
1.6666
0.1058
10
1.9242
0.5356
0.1601
1.0982
0.0549
11
0.0231
0.0065
0.1408
1.4234
0.0879
12
-1.2785
-0.3558
0.2439
-1.6982
-0.3089
13
-0.7956
-0.2214
0.3633
-0.8329
-0.6084
14
-0.9217
-0.2566
0.3381
-0.3581
-0.6367
15
-2.4225
-0.6743
0.0994
-1.4579
-0.8814
16
-5.7967
-1.6135
0.1111
-1.9867
-0.9031
17
4.4487
1.2382
0.0418
0.9887
0.8244
18
-4.9092
-1.3664
0.2499
-1.5432
-0.8974
19
11.7607
3.0786
0.5432
8.1111
0.2325
20
-0.4851
-0.1350
0.1444
-0.7943
-0.7299
Share
U
Capture
Crop
B
more
TII
Transcribed Image Text:Styles
EXAM PREPS
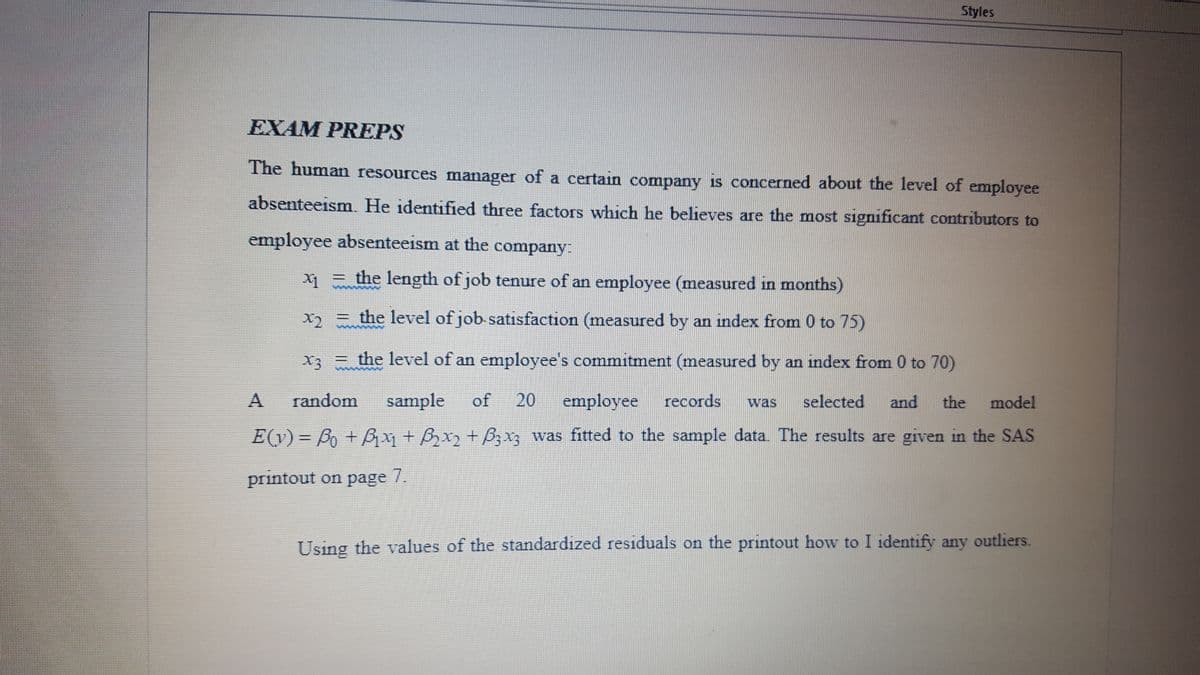
The human resources manager of a certain company is concerned about the level of employee
absenteeism. He identified three factors which he believes are the most significant contributors to
employee absenteeism at the company:
x = the length of job tenure of an employee (measured in months)
xɔ = the level of job satisfaction (measured by an index from 0 to 75)
x3 = the level of an employee's commitment (measured by an index from 0 to 70)
random
sample
of
20
employee
records
selected
and
the
model
was
E(v) = Bo +B + Bx2 + Bzx3 was fitted to the sample data. The results are given in the SAS
printout on page
7.
Using the values of the standardized residuals on the printout how to I identify any outliers.
Expert Solution
This question has been solved!
Explore an expertly crafted, step-by-step solution for a thorough understanding of key concepts.

Step by step
Solved in 2 steps

Knowledge Booster


Learn more about
Need a deep-dive on the concept behind this application? Look no further. Learn more about this topic, statistics and related others by exploring similar questions and additional content below.Recommended textbooks for you
Functions and Change: A Modeling Approach to Coll…
Algebra
ISBN:
9781337111348
Author:
Bruce Crauder, Benny Evans, Alan Noell
Publisher:
Cengage Learning

Linear Algebra: A Modern Introduction
Algebra
ISBN:
9781285463247
Author:
David Poole
Publisher:
Cengage Learning

Glencoe Algebra 1, Student Edition, 9780079039897…
Algebra
ISBN:
9780079039897
Author:
Carter
Publisher:
McGraw Hill
Functions and Change: A Modeling Approach to Coll…
Algebra
ISBN:
9781337111348
Author:
Bruce Crauder, Benny Evans, Alan Noell
Publisher:
Cengage Learning
Linear Algebra: A Modern Introduction
Algebra
ISBN:
9781285463247
Author:
David Poole
Publisher:
Cengage Learning
Glencoe Algebra 1, Student Edition, 9780079039897…
Algebra
ISBN:
9780079039897
Author:
Carter
Publisher:
McGraw Hill