The hydrolysis of the model peptide, benzoyl arginine ethyl ester, is catalyzed b initial velocity, (millimoles per minute or mmoles min-¹), of the reaction from the f linear regression analysis. Time (min) 0.4 0.9 1.4 1.9 mmoles hydrolyzed × 10 1.02 2.25 3.55 4.82
The hydrolysis of the model peptide, benzoyl arginine ethyl ester, is catalyzed b initial velocity, (millimoles per minute or mmoles min-¹), of the reaction from the f linear regression analysis. Time (min) 0.4 0.9 1.4 1.9 mmoles hydrolyzed × 10 1.02 2.25 3.55 4.82

Functions and Change: A Modeling Approach to College Algebra (MindTap Course List)
6th Edition
ISBN:9781337111348
Author:Bruce Crauder, Benny Evans, Alan Noell
Publisher:Bruce Crauder, Benny Evans, Alan Noell
Chapter5: A Survey Of Other Common Functions
Section5.6: Higher-degree Polynomials And Rational Functions
Problem 1TU: The following fictitious table shows kryptonite price, in dollar per gram, t years after 2006. t=...

Related questions
Question
5
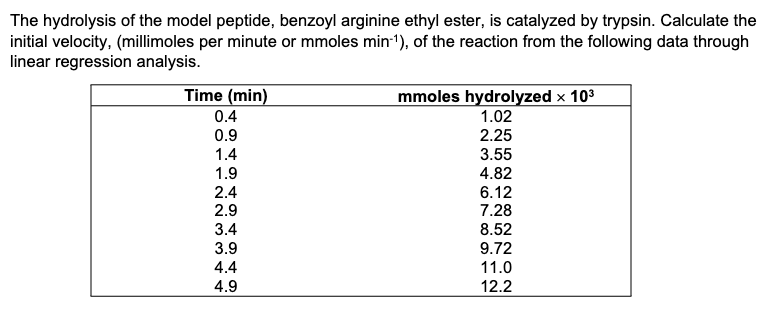
Transcribed Image Text:The hydrolysis of the model peptide, benzoyl arginine ethyl ester, is catalyzed by trypsin. Calculate the
initial velocity, (millimoles per minute or mmoles min-¹), of the reaction from the following data through
linear regression analysis.
Time (min)
0.4
0.9
1.4
1.9
2.4
2.9
3.4
3.9
4.4
4.9
mmoles hydrolyzed x 10³
1.02
2.25
3.55
4.82
6.12
7.28
8.52
9.72
11.0
12.2
Expert Solution
This question has been solved!
Explore an expertly crafted, step-by-step solution for a thorough understanding of key concepts.

Step by step
Solved in 2 steps with 1 images

Recommended textbooks for you
Functions and Change: A Modeling Approach to Coll…
Algebra
ISBN:
9781337111348
Author:
Bruce Crauder, Benny Evans, Alan Noell
Publisher:
Cengage Learning

Algebra & Trigonometry with Analytic Geometry
Algebra
ISBN:
9781133382119
Author:
Swokowski
Publisher:
Cengage

College Algebra
Algebra
ISBN:
9781305115545
Author:
James Stewart, Lothar Redlin, Saleem Watson
Publisher:
Cengage Learning
Functions and Change: A Modeling Approach to Coll…
Algebra
ISBN:
9781337111348
Author:
Bruce Crauder, Benny Evans, Alan Noell
Publisher:
Cengage Learning
Algebra & Trigonometry with Analytic Geometry
Algebra
ISBN:
9781133382119
Author:
Swokowski
Publisher:
Cengage
College Algebra
Algebra
ISBN:
9781305115545
Author:
James Stewart, Lothar Redlin, Saleem Watson
Publisher:
Cengage Learning

Algebra and Trigonometry (MindTap Course List)
Algebra
ISBN:
9781305071742
Author:
James Stewart, Lothar Redlin, Saleem Watson
Publisher:
Cengage Learning