The images contain data on employee’s perceived appreciation (appr; 1 = very low to 7 = very high), their perceived level of non-salary benefits (e.g., free coffee provision in office, bef; 1 = very negative to 7 = very positive), their satisfaction with the employer (sat; 1 = very dissatisfied to 7 = very satisfied), and the length of their service with the employer (tenure; in years). Based on them , write a problem statement on analyzing the effects of drivers on employee satisfaction or decline in employee satisfaction. Explain what kind of data is put to use ,and why a regression analysis would be better put to use rather than a variance analysis.
The images contain data on employee’s perceived appreciation (appr; 1 = very low to 7 = very high), their perceived level of non-salary benefits (e.g., free coffee provision in office, bef; 1 = very negative to 7 = very positive), their satisfaction with the employer (sat; 1 = very dissatisfied to 7 = very satisfied), and the length of their service with the employer (tenure; in years). Based on them , write a problem statement on analyzing the effects of drivers on employee satisfaction or decline in employee satisfaction. Explain what kind of data is put to use ,and why a regression analysis would be better put to use rather than a variance analysis.

College Algebra (MindTap Course List)
12th Edition
ISBN:9781305652231
Author:R. David Gustafson, Jeff Hughes
Publisher:R. David Gustafson, Jeff Hughes
Chapter8: Sequences, Series, And Probability
Section8.CR: Chapter Review
Problem 78E

Related questions
Question
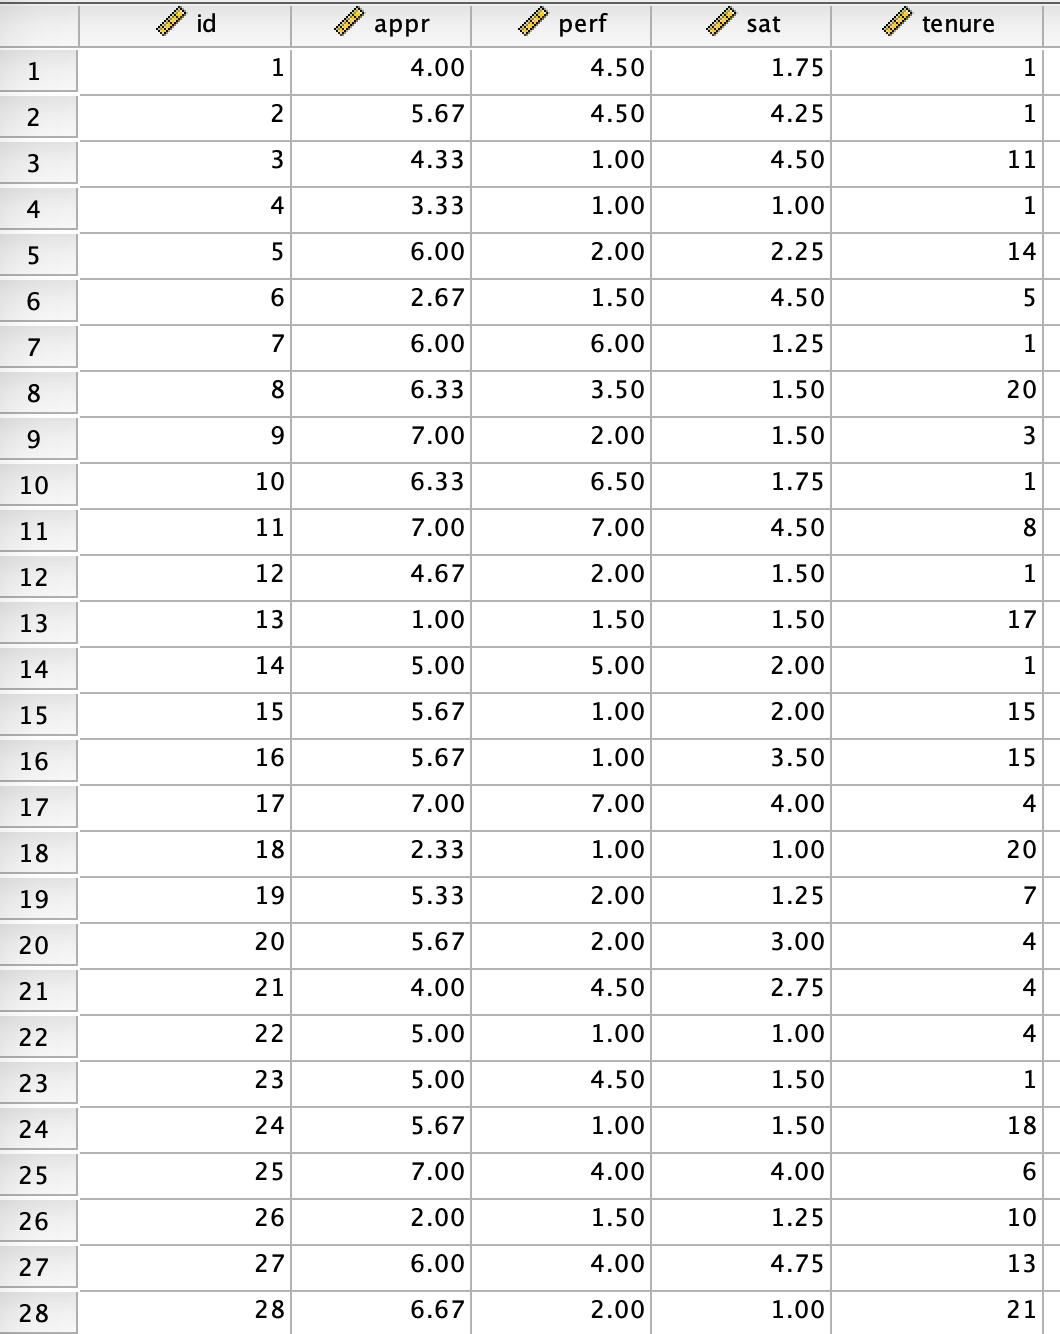
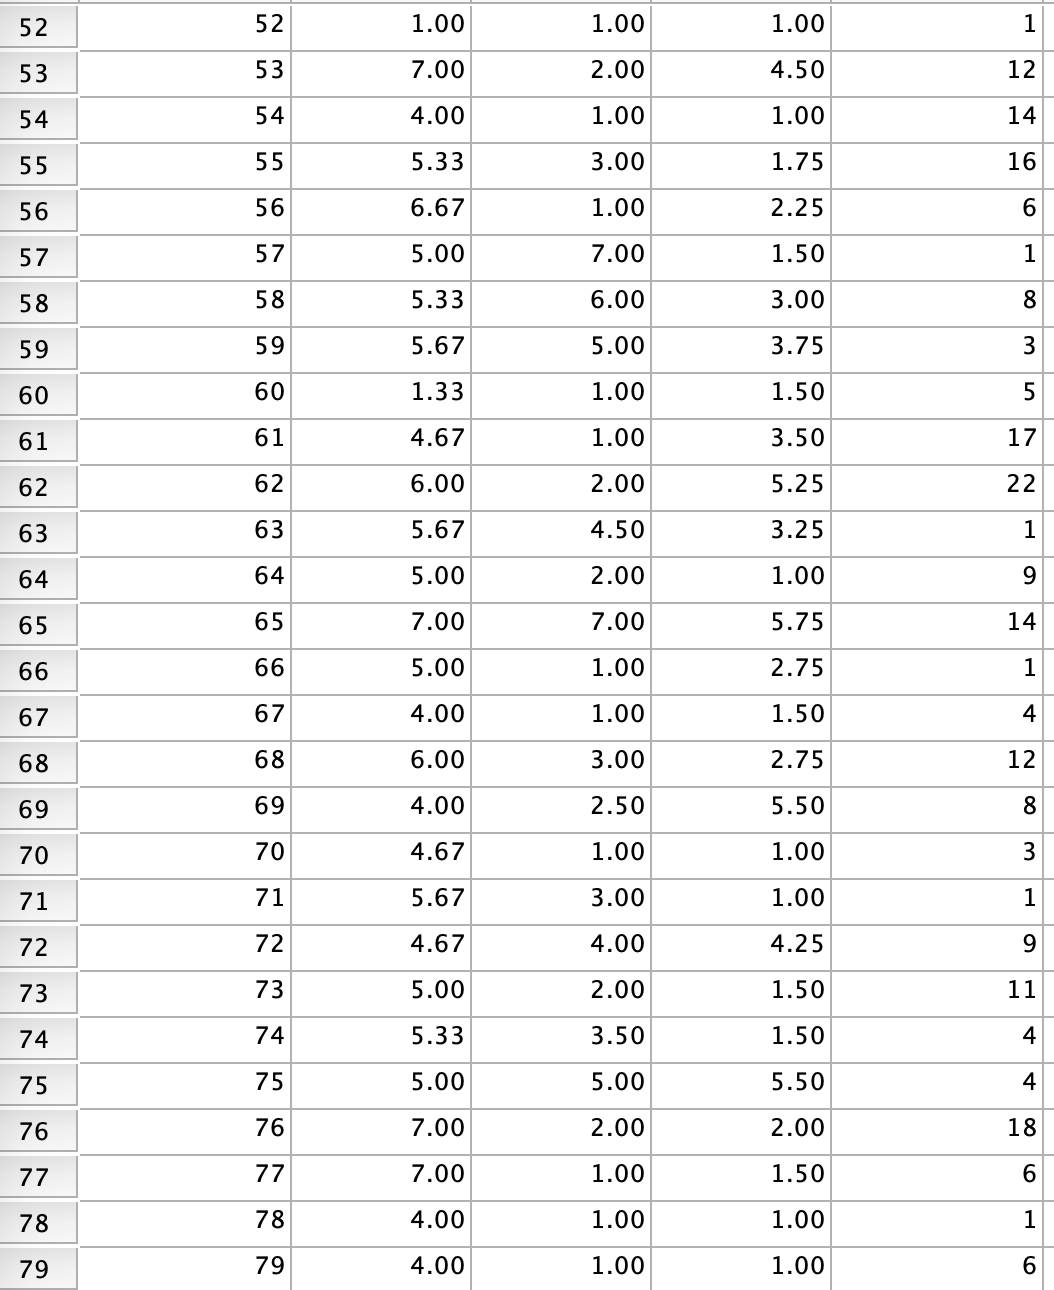
The images contain data on employee’s perceived appreciation (appr; 1 = very low to 7 = very high), their perceived level of non-salary benefits (e.g., free coffee provision in office, bef; 1 = very negative to 7 = very positive), their satisfaction with the employer (sat; 1 = very dissatisfied to 7 = very satisfied), and the length of their service with the employer (tenure; in years).
Based on them , write a problem statement on analyzing the effects of drivers on employee satisfaction or decline in employee satisfaction. Explain what kind of data is put to use ,and why a
Transcribed Image Text:1
2
3
4
LO
5
6
7
8
9
10
11
12
13
14
15
16
17
18
19
20
21
22
23
24
25
26
27
28
id
1
2
3
4
5
6
7
8
9
10
11
12
13
14
15
16
17
18
19
20
21
22
23
~~
24
25
26
27
28
appr
4.00
5.67
4.33
3.33
6.00
2.67
6.00
6.33
7.00
6.33
7.00
4.67
1.00
5.00
5.67
5.67
7.00
2.33
5.33
5.67
4.00
5.00
5.00
5.67
7.00
2.00
6.00
6.67
perf
4.50
4.50
1.00
1.00
2.00
1.50
6.00
3.50
2.00
6.50
7.00
2.00
1.50
5.00
1.00
1.00
7.00
1.00
2.00
2.00
4.50
1.00
4.50
1.00
4.00
1.50
4.00
2.00
sat
1.75
4.25
4.50
1.00
2.25
4.50
1.25
1.50
1.50
1.75
4.50
1.50
1.50
2.00
2.00
3.50
4.00
1.00
1.25
3.00
2.75
1.00
1.50
1.50
4.00
1.25
4.75
1.00
BESMETTETTE
tenure
1
1
11
1
14
5
1
20
3
1
8
1
17
1
15
15
4
20
7
4
4
4
1
18
6
10
13
21
Transcribed Image Text:52
53
54
55
56
57
58
59
60
61
62
63
64
65
66
67
68
69
70
71
72
73
74
75
76
77
78
79
52
53
54
55
56
57
58
59
60
61
62
63
64
65
66
67
68
69
70
71
72
73
74
75
76
77
78
79
1.00
7.00
4.00
5.33
6.67
5.00
5.33
5.67
1.33
4.67
6.00
5.67
5.00
7.00
5.00
4.00
6.00
4.00
4.67
5.67
4.67
5.00
5.33
5.00
7.00
7.00
4.00
4.00
1.00
2.00
1.00
3.00
1.00
7.00
6.00
5.00
1.00
1.00
2.00
4.50
2.00
7.00
1.00
1.00
3.00
2.50
1.00
3.00
4.00
2.00
3.50
5.00
2.00
1.00
1.00
1.00
1.00
4.50
1.00
1.75
2.25
1.50
3.00
3.75
1.50
3.50
5.25
3.25
1.00
5.75
2.75
1.50
2.75
5.50
1.00
1.00
4.25
1.50
1.50
5.50
2.00
1.50
1.00
1.00
1
12
14
16
6
1
8
3
5
17
22
1
9
14
1
4
12
8
3
1
9
11
4
4
18
6
1
6
Expert Solution
This question has been solved!
Explore an expertly crafted, step-by-step solution for a thorough understanding of key concepts.
Step 1: Write the given information
VIEWStep 2: Perform the regression analysis for the given data set
VIEWStep 3: Perform hypothesis test for the significance of variables appr, perf and tenure
VIEWStep 4: Compute the coefficient of determination and interpret it
VIEWStep 5: Explain what kind of data is put to use ,and why a regression analysis would be better
VIEWSolution
VIEW
Step by step
Solved in 6 steps with 11 images

Recommended textbooks for you
College Algebra (MindTap Course List)
Algebra
ISBN:
9781305652231
Author:
R. David Gustafson, Jeff Hughes
Publisher:
Cengage Learning

College Algebra (MindTap Course List)
Algebra
ISBN:
9781305652231
Author:
R. David Gustafson, Jeff Hughes
Publisher:
Cengage Learning