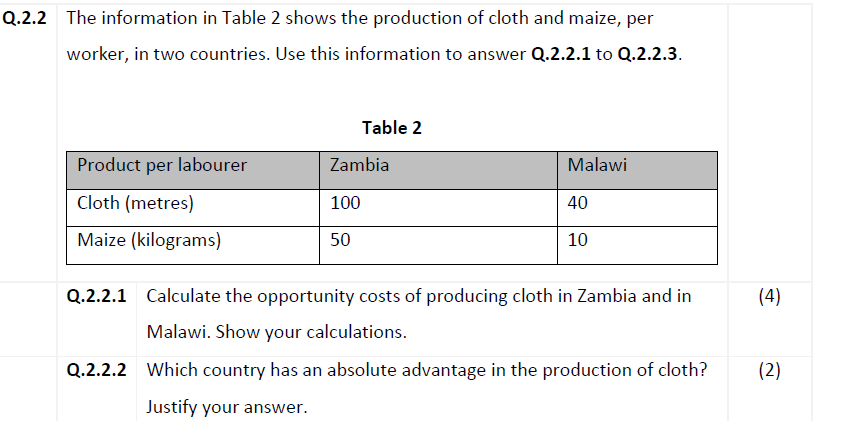
The information in Table 2 shows the production of cloth and maize, per worker, in two countries. Use this information to answer Q.2.2.1 to Q.2.2.3. Table 2 Product per labourer Zambia Malawi Cloth (metres) 100 40 Maize (kilograms) 50 10 Q.2.2.1 Calculate the opportunity costs of producing cloth in Zambia and in
Q: The following table shows the units of output a worker can produce per month in Germany and South…
A: Given : Steel (tons) PC (personal computer) Germany 20 10 South Korea 8 2
Q: The accompanying hypothetical production possibilities tables are for New Zealand and Spain. Each…
A:
Q: Question 10 This information applies to questions 10-13: Table 1 Output per Worker per hour Country…
A: In a market, opportunity cost implies the foregone benefit that an individual could earn if not…
Q: Poor country Rich country Wheat Cloth 6 8 2 20 (a) What are the opportunity cost ratios for these…
A: opportunity cost is the cost for gaining one opportunity , loose the other opportunity or we can say…
Q: 3) Refer to Figure 2-4. A movement from X to Y 13) ______ A) could occur because of an influx of…
A: PPF(Production Possibility Frontier) shows different levels of combination of two goods (here, food…
Q: Table 3-3 Labor Hours Needed to Make One Unit of: Amount Produced in 24 Hours: Baskets Birdhouses…
A: Comparative cost advantage: - it is a principle of international trade given by David Ricardo which…
Q: 4. Less lands are devoted to corn production 5. Philippines decreases the importation of yellow…
A: The law of supply says that when other things remain the same, if the price of the product…
Q: Indicate and explain how production and consumption gains arise with specialization in international…
A: The comparative advantage theory developed by David Ricardo in 19th Century, is the basis of…
Q: international trade Home has 1200 units of labor available. It can produce two goods, apples and…
A: International trade: International trade is that the transfer of capital, goods, and services across…
Q: 1. The output per laborer per day in the production of steel and tin for Russia and China are given…
A: Since we only answer up to 3 sub-parts, we’ll answer the first 3. Please resubmit the question and…
Q: QUESTION 6 PRODUCTION AND CONSUMPTION (TRADE) POSSIBILITIES FRONTIERS Portugal England 90 90 80 70…
A: Production possibility frontier: - it is the graphical representation of different combinations of…
Q: Country Airplanes produced in 100 worker hrs Dishwashers produced in 100 worker hrs Microtania…
A: The opportunity cost of 1 unit of good = what we sacrifice / what we get It takes 100 hours to…
Q: Draw a production possibilities curve that shows the production of possibilities of the US
A: PPC shows the combination of two goods which a country can produce given it's resources and…
Q: (b) Assuming that there are only two nations in the world, Africa and the USA, each nation produces…
A: I. Absolute advantage when compared between the production ability to produce two goods, considers…
Q: 3. Assume a country produces bag and potato only and follows "law of increasing opportunity cost".…
A: According to the "law of increasing opportunity cost", as the production of one good is increasing,…
Q: Table 1 Labour Hours Needed to Make 1 Kg of: Meat Potatoes Canada 8. Brazil 4 Refer to Table 1. How…
A: Absolute advantage refers to the ability of an individual, a firm or a country to produce more…
Q: international trade Home has 1200 units of labor available. It can produce two goods, apples and…
A: Trade is important for all the countries of the world. Trade includes exports and imports. There are…
Q: 1. Production Possibilities It has been determined that Germany and France can produce the following…
A: Production Possibility Frontier The graph is known as the Production Possibilities Frontier (PPF)…
Q: Home has 1200 units of labor available. It can produce two goods, apples and bananas. The unit labor…
A: Answer -
Q: UNITED STATES SOUTH KOREA VCR PHOTOCOPIER VCR PHOTOCOPIER 0 800 800…
A: Since you have posted multiple sub-parts, we are answering the first three for you. If you want a…
Q: Home country has 1200 units of labor available while Foreign country has 800 units of labor. In Home…
A: Each country has different level of labor unit requirements for both the goods apples and bananas.
Q: The table below presents the production possibilities schedules for the cities of Venice and…
A: Opportunity cost is the cost that is given in order to obtain more of a desired good. When a choice…
Q: Question 5. Countries A and B have two factors of production, capital and labor, with which they…
A: Given, Two countries = A and B Factors of production = Capital (K) and labor (L) Two goods = X and…
Q: 4. The cost of producing 1 apple is lower in the country. Your answer 5. The cost of producing 1…
A: International trade refers to the exchange of goods and services outside the country with different…
Q: a) Using the figure 1 (a) given below explain why is point 2 unattainable? Figure 1 (a) Capital…
A: The production possibility frontier illustrates the various combinations of two goods that can be…
Q: Graph 1 Graph 2 PPF PPE TABLETS TABLETS Based on the previous description, the trade-off Japan faces…
A: * ANSWER :- Based on the given information the answer is given below
Q: Table 2 Product per labourer Zambia Malawi Cloth (metres) 100 40 Maize (kilograms) 50 10 Q.2.2.1…
A: Opportunity cost = What is sacrificed / What is gained
Q: Alexandra’s Production Possibilities Schedule Natalia’s Production Possibilities Schedule Number of…
A: A country or a person exports the good in which it has a comparative advantage.
Q: produce either 5 cloths or 10 wines. In the US, one hour of workers labor can produce either 20…
A: Opportunity cost measures the input need to be given up in order to obtain other input.
Q: Figure 2-4 shows various points on three different production possibilities frontiers for a nation.…
A: Influx of mmigration of labor means that there is an increase in the labor force and hence more…
Q: Production possibilities of the United States (USA) and South Africa (RSA): USA RSA wheat…
A: Production Possibilities frontier shows the possibility of the production of two goods and services…
Q: The table below describes production possibilities for Mexico and Nigeria. Each number in the table…
A: Mexico needs 10 workers to produce one unit of the shoe and 12 workers to produce one unit of…
Q: Portugal England 90 90 80 80 70 70 60 60 CPF 50 + 50 40 40 30 30 CPF PPF 20 PPF 20 10 10 0 10 20 30…
A: The international trade theory studies the pattern of trade between different countries. Various…
Q: QUESTION 22 Figure 2-4 Food products W Plastic products Figure 2-4 shows various points on three…
A:
Q: Table 1 shows the production possibilities for the USA and Mexico.…
A: Opportunity cost is the benefit from a good that an individual has to forgo in order to substitute…
Q: The following table shows per-day production data of rice and T-shirts for two countries, Cambria…
A: Opportunity cost: - opportunity cost is a forgone benefit which we could have earned by applying all…
Q: (Table) Based on the table, what is Mexico's opportunity cost of making one airplane: Canada's…
A: Production Possibility Curve or frontier is the representation of all the possible combination using…
Q: Assume that during the years 2022 to 2025 Woodland Republic could produce only two commodities:…
A: Below is the given table:
Q: 26 of 100 The table in Figure 2 shows the amounts of potatoes and beets that Robert and Clarence can…
A: Opportunity Cost: It explains that when a country can produce two goods (let says either X or Y),…
Q: More than 200 years ago, Adam Smith argued that the wealth of nations depends upon gains from (a)…
A: The view of Adam Smith is correct that the wealth of nation is associated with the gain from the…
Q: There is now also another country, Foreign, there is a labor force of 800. Foreign's unit labor…
A: Given Total labor force of foreign =800 To produce 1 unit of watermelon, 5 unit of labor force is…
Q: Figure 3-11 The graph below represents the various combinations of ham and cheese (in pounds) that…
A: We will answer the first question since the exact one was not specified. Please submit a new…
Q: Economics 3. Consider the following table that presents the labour requirements for production in…
A: Opportunity costs, the expenses and advantages of each and every choice accessible should be thought…
Step by step
Solved in 2 steps
- Review the numbers for Canada and Venezuela from Table 33.12 which describes how many barrels of oil and tons of lumber the workers can produce. Use these numbers to answer the rest of this question. Draw a production possibilities frontier for each country. Assume there are 100 workers in each country. Canadians and Venezuelans desire both oil and lumber. Canadians want at least 2,000 tons of lumber. Mark a point on their production possibilities where they can get at least 3,000 tons. Assume that the Canadians specialize completely because they figured out they have a comparative advantage in lumber. They are willing to give up 1,000 tons of lumber. How much oil should they ask for in return for this lumber to be as well off as they were with no trade? How much should they ask for if they want to gain from trading with Venezuela? Note: We can think of this ask as the relative price or trade price of lumber. Is the Canadian ask you identified in (b) also beneficial for Venezuelans? Use the production possibilities frontier graph for Venezuela to show that Venezuelans can gain from trade.Question 4 There is now also another country, Foreign, there is a labor force of 800. Foreign's unit labor requirement in watermelon production is 5, while in kiwi production it is 1. a) how many units of watermelon can be produced? when the labor in Foreign country only produce watermelon. b) how many units of kiwi can be produced? When all the labor in Foreign country only produce kiwi. c) What is the opportunity cost of watermelon in terms of kiwi in Foreign country? d) Describe the pattern of trade. Home country should produce? Foreign country should produce? Why? e) Show that how both Home and Foreign country gain from trade.20. Australia and New Zealand both produce wool and wine. Australia can either produce 200 litres of wine or40 tonnes of wool per week. New Zealand can either produce 40 litres of wine or 10 tonnes of wool per week.Australia’s opportunity cost of producing 1 ton of wool is equal to: (4 marks)A 200 litres of wine.B 50 litres of wine.C 40 litres of wine.D 5 litres of wine.
- In France, one hour of a worker’s labor can produce either 5 cloths or 10 wines. In the US, one hour of workers labor can produce either 20 cloths or 20 wines. Can you show math work? What is the opportunity cost in France for 1 cloth? How about 1 wine? What is the opportunity cost in US of 1 cloth? How about 1 wine? Should these two countries trade? Who should make wine and who should make cloth? Why?Combination Bananas metric tons (X axis) Coffee metric tons (Y axis) A 20,000 0 B 18,000 11,000 C 14,000 20,000 D 8,000 27,000 E 0 30,000 What is the opportunity cost (amount & item) of increasing production from 27,000 tons of coffee to 30,000 tons of coffee ? ________________ What is happening to the opportunity cost as Costa Rica produces more coffeeb. What is the opportunity cost of 1 ton of apples for the nations of Argentina and Brazil, respectively?A. 4 tons of oranges and 2 tons of orangesB. 2.5 tons of oranges and .4 tons of orangesC. .25 tons of oranges and .5 tons of oranges D. 2 tons of oranges and 4 tons of oranges E. 5 tons of oranges and .25 tons of oranges
- Consider two countries, Zerka and Xena. In Zerka total annual output is worth $500 million and people work 40 million hours. In Xena total annual output is worth $600 million and people work 50 million hours. A) From the information above, in which country is productivity higher? B) Economists use the term ______________________________ to refer to the ability to produce a good using fewer inputs than another producer. C) Economists use the term ______________________________ to refer to the ability to produce a good at a lower opportunity cost than another producer.Draw a production possibilities curve that shows the production of possibilities of the US and S Korea. See attached.Suppose that Spain and Switzerland both produce oil and shoes. Spain's opportunity cost of producing a pair of shoes is 3 barrels of oil while Switzerland's opportunity cost of producing a pair of shoes is 11 barrels of oil. 33.3
- Combination Cinnamon metric tons (X axis) Nutmeg metric tons (Y axis) A 7,000 0 B 6,000 7,000 C 4,500 11,000 D 2,500 14,000 E 0 16,000 What is the opportunity cost (amount & item) of the first 7,000 tons of nutmeg produced? ______________________ What is the opportunity cost (amount & item) of increasing production from 7,000 tons of nutmeg to 11,000 tons of nutmeg ? ________________ What is the opportunity cost (amount & item )of increasing production from 11,000 tons of nutmeg to 14,000 tons of nutmeg ? _____________ What is the opportunity cost (amount & item) of increasing production from 14,000 tons of nutmeg to 16,000 tons of nutmeg ? ________________ What is happening to the opportunity cost as Copperton produces more nutmeg? ____________________________________American and Japanese workers can each produce 4 cars per year. An American worker can produce 10 tons of grain per year, whereas a Japanese worker can produce 5 tons of grain per year. To keep things simple, assume that each country has 100 million workers. For this situation, construct a table analogous to the table in Figure 1. Graph the production possibilities frontiers for the American and Japanese economies. For the United States, what is the opportunity cost of a car? Of grain? For Japan, what is the opportunity cost of a car? Of grain? Put this information in a table analogous to Table 1. Which country has an absolute advantage in producing cars? In producing grain? Which country has a comparative advantage in producing cars? In producing grain? Without trade, half of each country’s workers produce cars and half produce grain. What quantities of cars and grain does each country produce? Starting from a position without trade, give an example in which trade makes each country…Figure 2-4 shows various points on three different production possibilities frontiers for a nation. 7) Refer to Figure 2-4. A movement from ________ could occur because of an influx of immigrant labor. 7) _______ A) W to Z B) Y to W C) W to V D) X to W