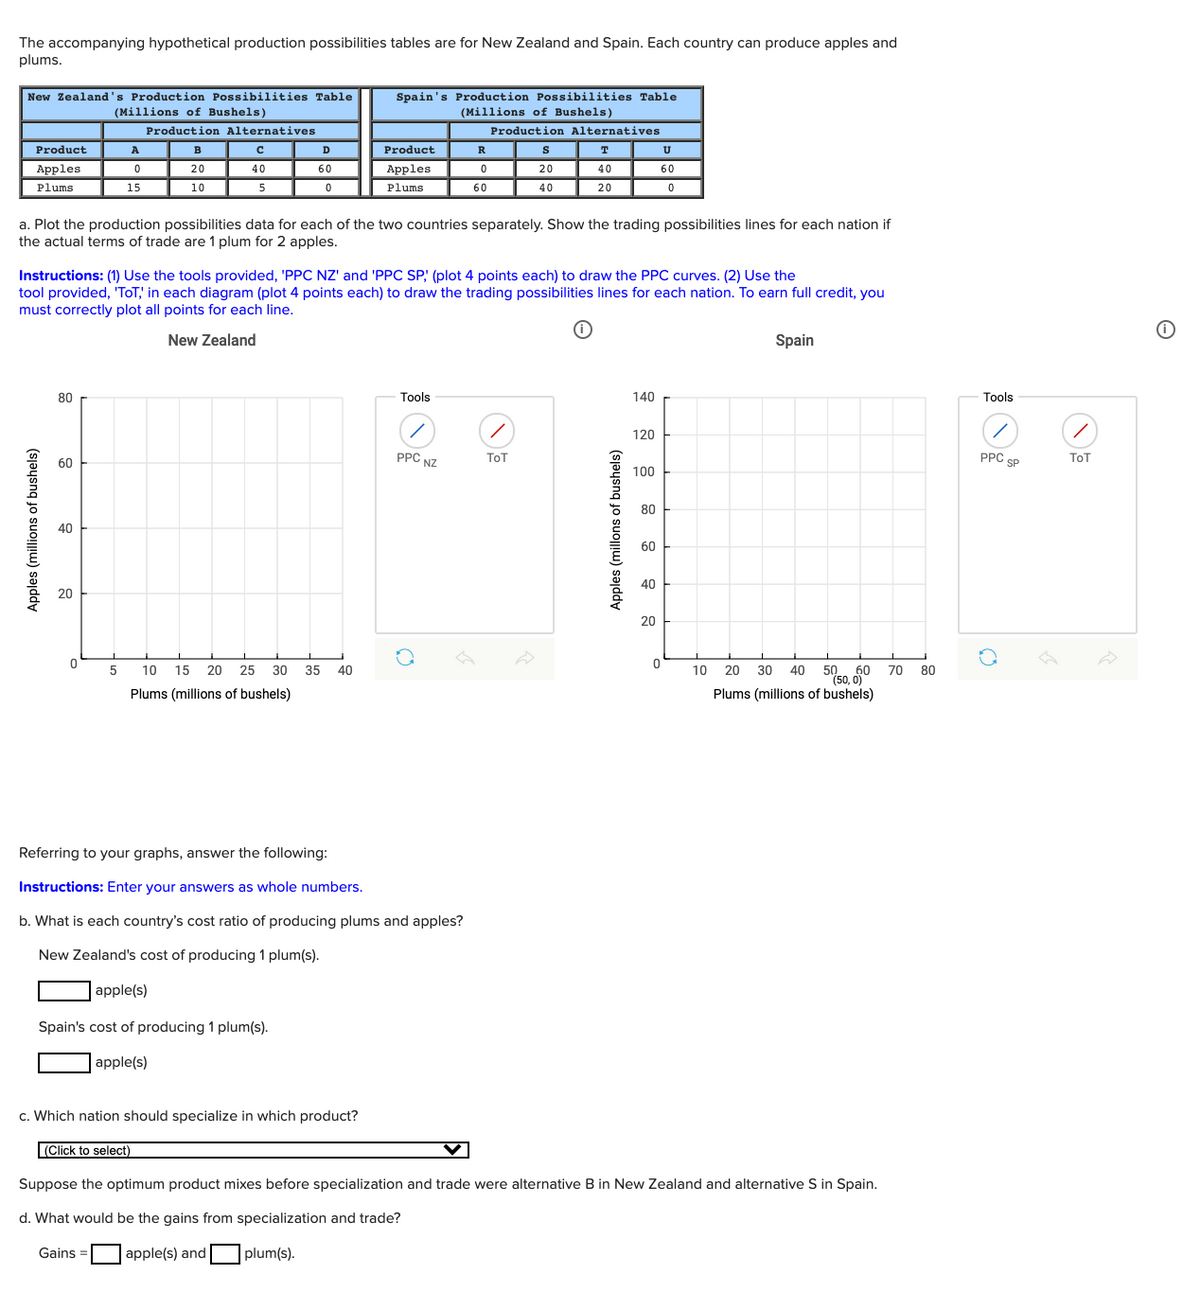
The accompanying hypothetical production possibilities tables are for New Zealand and Spain. Each country can produce apples and plums. New Zealand's Production Possibilities Table Spain's Production Possibilities Table (Millions of Bushels) (Millions of Bushels) Production Alternatives Production Alternatives Product в D Product R Apples 20 40 60 Apples 20 40 60 Plums 15 10 5 Plums 60 40 20 a. Plot the production possibilities data for each of the two countries separately. Show the trading possibilities lines for each nation if the actual terms of trade are 1 plum for 2 apples. Instructions: (1) Use the tools provided, 'PPC NZ' and 'PPC SP; (plot 4 points each) to draw the PPC curves. (2) Use the tool provided, 'TOT,' in each diagram (plot 4 points each) to draw the trading possibilities lines for each nation. To earn full credit, you must correctly plot all points for each line. New Zealand Spain 80 Tools 140 Tools 120 PPC NZ Тот PPC ToT 60 SP 100 80 40 60 40 20 20 50. 60 (50, 0) 10 15 20 25 30 35 40 10 20 30 40 70 80 Plums (millions of bushels) Plums (millions of bushels) Referring to your graphs, answer the following: Instructions: Enter your answers as whole numbers. b. What is each country's cost ratio of producing plums and apples? New Zealand's cost of producing 1 plum(s). apple(s) Spain's cost of producing 1 plum(s). apple(s) c. Which nation should specialize in which product? (Click to select) Suppose the optimum product mixes before specialization and trade were alternative B in New Zealand and alternative S in Spain. d. What would be the gains from specialization and trade? Gains = apple(s) and plum(s). Apples (millions of bushels) Apples (millons of bushels)
The accompanying hypothetical production possibilities tables are for New Zealand and Spain. Each country can produce apples and plums. New Zealand's Production Possibilities Table Spain's Production Possibilities Table (Millions of Bushels) (Millions of Bushels) Production Alternatives Production Alternatives Product в D Product R Apples 20 40 60 Apples 20 40 60 Plums 15 10 5 Plums 60 40 20 a. Plot the production possibilities data for each of the two countries separately. Show the trading possibilities lines for each nation if the actual terms of trade are 1 plum for 2 apples. Instructions: (1) Use the tools provided, 'PPC NZ' and 'PPC SP; (plot 4 points each) to draw the PPC curves. (2) Use the tool provided, 'TOT,' in each diagram (plot 4 points each) to draw the trading possibilities lines for each nation. To earn full credit, you must correctly plot all points for each line. New Zealand Spain 80 Tools 140 Tools 120 PPC NZ Тот PPC ToT 60 SP 100 80 40 60 40 20 20 50. 60 (50, 0) 10 15 20 25 30 35 40 10 20 30 40 70 80 Plums (millions of bushels) Plums (millions of bushels) Referring to your graphs, answer the following: Instructions: Enter your answers as whole numbers. b. What is each country's cost ratio of producing plums and apples? New Zealand's cost of producing 1 plum(s). apple(s) Spain's cost of producing 1 plum(s). apple(s) c. Which nation should specialize in which product? (Click to select) Suppose the optimum product mixes before specialization and trade were alternative B in New Zealand and alternative S in Spain. d. What would be the gains from specialization and trade? Gains = apple(s) and plum(s). Apples (millions of bushels) Apples (millons of bushels)

Chapter1: The Role And Method Of Economics
Section: Chapter Questions
Problem 9P

Related questions
Question
Transcribed Image Text:The accompanying hypothetical production possibilities tables are for New Zealand and Spain. Each country can produce apples and
plums.
New Zealand's Production Possibilities Table
Spain's Production Possibilities Table
(Millions of Bushels)
(Millions of Bushels)
Production Alternatives
Production Alternatives
Product
A
в
D
Product
R
T
U
Apples
20
40
I 60
Apples
40
20
60
Plums
15
10
5
Plums
60
40
20
a. Plot the production possibilities data for each of the two countries separately. Show the trading possibilities lines for each nation if
the actual terms of trade are 1 plum for 2 apples.
Instructions: (1) Use the tools provided, 'PPC NZ' and 'PPC SP, (plot 4 points each) to draw the PPC curves. (2) Use the
tool provided, 'ToT,' in each diagram (plot 4 points each) to draw the trading possibilities lines for each nation. To earn full credit, you
must correctly plot all points for each line.
New Zealand
Spain
80
Tools
140
Tools
120
PPC NZ
PPC SP
ToT
Тот
60
100
80
40
60
40
20
20
50
(50, 0)
Plums (millions of bushels)
5
10
15
20
25
30
35
40
10 20
30
40
60
70
80
Plums (millions of bushels)
Referring to your graphs, answer the following:
Instructions: Enter your answers as whole numbers.
b. What is each country's cost ratio of producing plums and apples?
New Zealand's cost of producing 1 plum(s).
apple(s)
Spain's cost of producing 1 plum(s).
apple(s)
c. Which nation should specialize in which product?
|(Click to select)
Suppose the optimum product mixes before specialization and trade were alternative B in New Zealand and alternative S in Spain.
d. What woul
be the gains
specialization and trade?
Gains =
apple(s) and plum(s).
Apples (millions of bushels)
Apples (millons of bushels)
Expert Solution
This question has been solved!
Explore an expertly crafted, step-by-step solution for a thorough understanding of key concepts.

This is a popular solution!

Trending now
This is a popular solution!

Step by step
Solved in 2 steps with 4 images

Knowledge Booster


Learn more about
Need a deep-dive on the concept behind this application? Look no further. Learn more about this topic, economics and related others by exploring similar questions and additional content below.Recommended textbooks for you
Exploring Economics
Economics
ISBN:
9781544336329
Author:
Robert L. Sexton
Publisher:
SAGE Publications, Inc

Principles of Economics 2e
Economics
ISBN:
9781947172364
Author:
Steven A. Greenlaw; David Shapiro
Publisher:
OpenStax
Exploring Economics
Economics
ISBN:
9781544336329
Author:
Robert L. Sexton
Publisher:
SAGE Publications, Inc
Principles of Economics 2e
Economics
ISBN:
9781947172364
Author:
Steven A. Greenlaw; David Shapiro
Publisher:
OpenStax