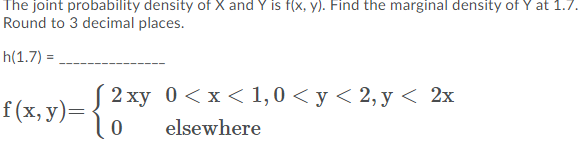
The joint probability density of X and Y is f(x, y). Find the marginal density of Y at 1.7. Round to 3 decimal places. h(1.7) = 2 ху 0 <х< 1,0 <у<2,у < 2х f(x, y)= elsewhere


Q: What percentage of the students' undergraduate major is Engineering?
A: Here we have given the table of survey of 400 college seniors resulted in their undergraduate major…
Q: Q5/ Use Linear Regression to fit the following data: 2 3 4 5 6 Y 4 9 10 10 9 8 3
A: We have given that, X :- 0, 1, 2, 3, 4, 5, 6 Y:- 4, 9, 10, 10, 9, 8, 3 Then, We will find the…
Q: Identify the sampling procedure used in each given research titles. Provide justification for your…
A: Here we have to give the sampling method and justification for 1. Birth Order 2. Career Choices of…
Q: Is the statement below True or False? Explain your choice, and be sure to reference any appropriate…
A:
Q: Consider the following sodium content of 26 randomly picked canned food. Propose ropriate data…
A: Given information: Sodium content of 26 randomly picked canned food. MINITAB Procedure: Choose Stat…
Q: 1. Let X~Poisson(a). Show that E[X(X – 1)(X – 2) ... (X – k)] = ak+1 -
A: Solution
Q: The numbers of hours worked (per week) by 400 statistics students are shown below. Number of Hours…
A: The frequency of the students working less than 20 hours is 40.
Q: 90 85 75 76 81 76 75 76 76 96 89 88 73 81 93 76 76 96 89 88 73 81 89 74 74 74 76 86 75 96 79 73 86…
A: x x2 90 8100 85 7225 75 5625 76 5776 81 6561 76 5776 75 5625 76 5776 76 5776 96…
Q: When the members of a family discussed where their annual reunion should take place, they found…
A: Given: Shorthand representation NP= Not go to the park NB= Not go to the beach NC= Not go to the…
Q: 4. The moment-generating function of a random variable X is est – e4t M(t) t + 0, and M(0) = 1. 4t…
A: Solution
Q: The number of sick days taken (per month) by 200 factory workers is summarized below. Number of…
A: As per our guidelines we are supposed to answer only one question per post so I am solving first…
Q: Looking at the following residual plot, what can you conclude
A: Residual plot analysis is critical to verification of linear regression assumption.
Q: recent survey by the U.S. Census Bureau determined that the median monthly housing rent was $640. If…
A: Given that Median=640 First Quartile=496
Q: Suppose you are testing H0: μ = 21 vs. H1: μ > 21, from a normal distribution with σ² = 28 and n =…
A:
Q: Standardized Exp(1) N(0, 1) Standardized Exp(1) - N(0, 1) 30 35 40 45 50 In this quuton , the mill…
A: Solution: As per the guidelines first three parts should be answered.
Q: Find the area, to the nearest thousandth, of the indicated region of the standard normal…
A: Find the area, to the nearest thousandth, of the indicated region of the standard normal…
Q: In the least-squares line ŷ = 5 − 2x, what is the value of the slope? In the least-squares line ŷ…
A: The question is based on to check value and interpretation of slope of estimated regression line.
Q: A perfume company found out that their daily number of sales is 8 units. They hired a new agent and…
A:
Q: Find the equation of the regression line for the given data. Then construct a scatter plot of the…
A: X: 0,2,3,4,5,5 Y: 38,44,52,47,63,67
Q: 23.15 a barber runs a one-man shop. he does not make appointments but attends customers on a…
A: Given information: As per guidelines we will only answer the first three subparts, please repost…
Q: QUESTION 6 A museum charges $10 for an adult ticket and $5 for a child ticket. On a given day, 48…
A: Note: As per my policy i can answer only one question. kindly repost the remaining question.…
Q: 2. A random variable X has a probability density function (pdf) given by , 0< x < 1, f(x) = c, 1<x <…
A: Note: As per expert instructions we can only solve first 4 sub questions. We have to calculate…
Q: With larger and larger numbers of categories in chi-square tests, the chi-square distribution takes…
A: Given that Option 4 is the correct choice
Q: Create a standard normal curve for each given, find the areas under the normal curve and shade the…
A: Let X be a random variable following normal distribution with mean μ and variance σ2. Let us take…
Q: Match the following terms to their symbols Sample Standard deviation 1. n Population mean 2. X…
A: We have given the following symbols
Q: Consider the following summary output, which was generated from a sample of 8 employees relating age…
A: From the given data R^2 = ? R^2 = 0.019068636
Q: The data below was collected from manufacturer advertisements of their vehicles' horsepower and…
A: Correlation are used to understand whether there is any association between the two numerical…
Q: FOR EACH PROBLEM BELOW, a) formulate the null and alternative hypotheses; b) Determine what test…
A: Given that Hypothesized Population Mean (\mu)(μ) = 60006000 Sample Standard Deviation (s)(s) =…
Q: What do standard deviation, range, and IQR tell us about a data set? O They tell us how many points…
A: What do standard deviation ,range,and IQR tell us about a data set ?
Q: The amount of time it takes for a student to complete an online statistics exam is uniformly…
A: Given that a=84 , b=107 X~Uniform (a, b) NOTE:- According to bartleby guidelines expert can solve…
Q: ollege tuition: A simple random sample of 40 colleges and universities in the United States has a…
A: A random sample of 40 colleges; n=40 A mean tuition of 18900 with a standard deviation of 10400;…
Q: Pie chart is a graphical device for .depicting qualitative data
A: Two statements are given
Q: The test statistic of z = - 2.88 is obtained when testing the claim that p# 0.375. This is a…
A: We have given that Test Statistics z = -2.88 Claim : p ≠ 0.375 (two tailed test) Significance level…
Q: If the test statistic is y2 = 0.579 and the critical value is y2 = 5.991, what is your conclusion…
A: We have given that The test statistic is χ2 = 0.579 The critical value is χ2 = 5.991
Q: Solvent cement is used to join PVC joints. Researchers are interested in predicting the amount of…
A: From the output, the slope is -0.061 and the intercept is 8.693.
Q: 4 students are picked at random for a student wellness committee, what’s the chance that all 4 are…
A: We have given that the random variable X represents the female. P( female ) = p = 39.6% = 0.396 P(…
Q: Find the value of the linear correlation coefficient r. 19.3 23.4 10.3 17.7 23.2 3 3 0.056 -0.236…
A: Given that X Y X \cdot YX⋅Y X^2X2 Y^2Y2 19.3 3 57.9 372.49 9 23.4 3 70.2 547.56 9…
Q: Let X1, X2, ..., X, be a random sample from a population r.v. X ~ N(0,0²), with o to be known. Show…
A: Given X~N(θ,σ2)
Q: Let X , Y be two random variables with the following joint probability mass function: X/Y 2 6 -2…
A: Solution-: We have given following table: X\Y 2 6 -2 8 -2 0.109422 0.0270663 0.0223591…
Q: new and innovative children's toys. As with other products, Specialty faces the decision of how may…
A:
Q: A drug test correctly gives a positive result 88 percent of the time. However, 3 percent of the…
A: Introduction: Denote X as the event that a person actually has one or more of the drugs in their…
Q: Using the data in the Excel spreadsheet "auto.xlsx", estimate a regression to answer the following…
A: Based on the given statement, the dependent variable is Price. And the independent variable is…
Q: V. EV Variance standard deviation of 18kls. Suppose that the distribution of weights is not normal…
A: We have given that Mean = 60 Standard deviation = 18 Note: According to Bartleby expert…
Q: 3. Suppose a value is chosen “at random" in the interval [0,6]. In other words, x is an observed…
A:
Q: I. Creatively illustrate and explain the different properties of the standard normal curve. *Write…
A: Standard normal curve: Standard normal curve or standard normal distribution has a mean of 0 and a…
Q: Round each z-score to the nearest hundredth. A data set has a mean of x = 214 and a standard…
A: The mean is 214 and the standard deviation is 44.
Q: 1. A survey of 30 households found that the mean age of an LED TV is 5 years. Assuming the standard…
A: A survey of 30 households; n=30 The mean of an LED TV is 5 years; x=5 years The standard deviation…
Q: Rondale notices that the best bowlers in his bowling league tend to be very outgoing. To test this…
A: Descriptive analsyis explain the summary of the data. Each research has been studied using the…
Q: A chain of paint stores produces and sells latex and semi-enamel paint. Based on long-term sales,…
A: Given that a chain of paint stores produces. The probability that a customer buys latex paint is…
Q: The least-squares regression equation is y = 753.6x+ 12,900 where y is the median income and x is…
A:


Trending now
This is a popular solution!

Step by step
Solved in 2 steps with 1 images

- The random vector (X,Y) has the following joint probability density function:f(X,Y)(x,y) ={4xye−(x^2+y^2), x >0, y >0, 0, otherwise LetZ=√(X2+Y2) Find the probability density of the random variableZ.If X has the uniform density with the parameters α = 0and β = 1, use the distribution function technique to findthe probability density of the random variable Y = √X.Suppose random variable X has a density function f ( x ) = { 2 /x 2 , 1 ≤ x ≤ 2 0 , o t h e r w i s e . Then E[X4] =?
- For random variables X and Y with joint density function f(x,y) = 6e^-2x-3y. (x,y > 0) and f(x,y) = 0 otherwise, find: Are X and Y independent? Give a reason for your answer.Suppose that the random variables X and Y have a joint density function given by: f(x,y)={cxy for 0≤x≤2 and 0≤y≤x, 0 otherwise Find the constant c, P(Y≥1/2), P(X < 2, Y >1/2), P(X < 1), Determine whether X and Y are independent.If the joint probability density of X and Y is given by f(x, y) =⎧⎪⎨⎪⎩4xye−(x2+y2) for x > 0, y > 00 elsewhere and Z = X2 + Y2, find(a) the distribution function of Z;(b) the probability density of Z.
- If X is uniformly distributed over (0,1), find the density function of Y = eXThe random vector (X, Y ) has the following joint probability density function:f(X,Y )(x, y) = 4xye^−(x2+y2), x > 0, y > 0,0 , otherwiseLet Z =√(X^2 + Y ^2) . Find the probability density of the random variable Z.For a certain psychiatric clinic suppose that the random variable X represents the total time (in minutes) that a typical patient spends in this clinic during a typical visit (where this total time is the sum of the waiting time and the treatment time), and that the random variable Y represents the waiting time (in minutes) that a typical patient spends in the waiting room before starting treatment with a psychiatrist. Further, suppose that X and Y can be assumed to follow the bivariate density function fXY(x,y)=λ2e−λx, 0<y<x, where λ > 0 is a known parameter value. (a) Find the marginal density fX(x) for the total amount of time spent at the clinic. (b) Find the conditional density for waiting time, given the total time. (c) Find P (Y > 20 | X = x), the probability a patient waits more than 20 minutes if their total clinic visit is x minutes. (Hint: you will need to consider two cases, if x < 20 and if x ≥ 20.)
- If the joint probability density of X and Y is given byf(x, y) = 24y(1 − x − y) for x > 0, y > 0, x + y < 10 elsewhere find(a) the marginal density of X;(b) the marginal density of Y.Also determine whether the two random variables areindependent.Let X and Y be two independent random variables with densities fX(x) = e^(-x), for x>0 and fY(y) = e^y, for y<0, respectively. Determine the density of X+Y.Suppose that the random variables X and Y have a joint density function given by: f(x,y) = {c(2x+y) for 2≤x≤6 and 0≤y≤5, 0 otherwise Find the constant c, Find the marginal distribution functions(cdfs) for X and Y, Find the marginal density functions(pdfs) for X and Y, P(3 < X < 5, Y >1), P(X < 3), P(X +Y > 5), Find the joint distribution function (cdf),