Consider the following summary output, which was generated from a sample of 8 employees relating age to annual salary. SUMMARY OUTPUT Regression Statistics Multiple R 0.138089232 R Square 0.019068636 Adjusted R Square -0.144419925 Standard Error 1.46902996 Observations 8. ANOVA df SS MS F Regression 1 0.251706 0.252 0.116775 Residual 6. 12.948294 2.158 Total. 7. 13.2
Consider the following summary output, which was generated from a sample of 8 employees relating age to annual salary. SUMMARY OUTPUT Regression Statistics Multiple R 0.138089232 R Square 0.019068636 Adjusted R Square -0.144419925 Standard Error 1.46902996 Observations 8. ANOVA df SS MS F Regression 1 0.251706 0.252 0.116775 Residual 6. 12.948294 2.158 Total. 7. 13.2

MATLAB: An Introduction with Applications
6th Edition
ISBN:9781119256830
Author:Amos Gilat
Publisher:Amos Gilat
Chapter1: Starting With Matlab
Section: Chapter Questions
Problem 1P

Related questions
Question
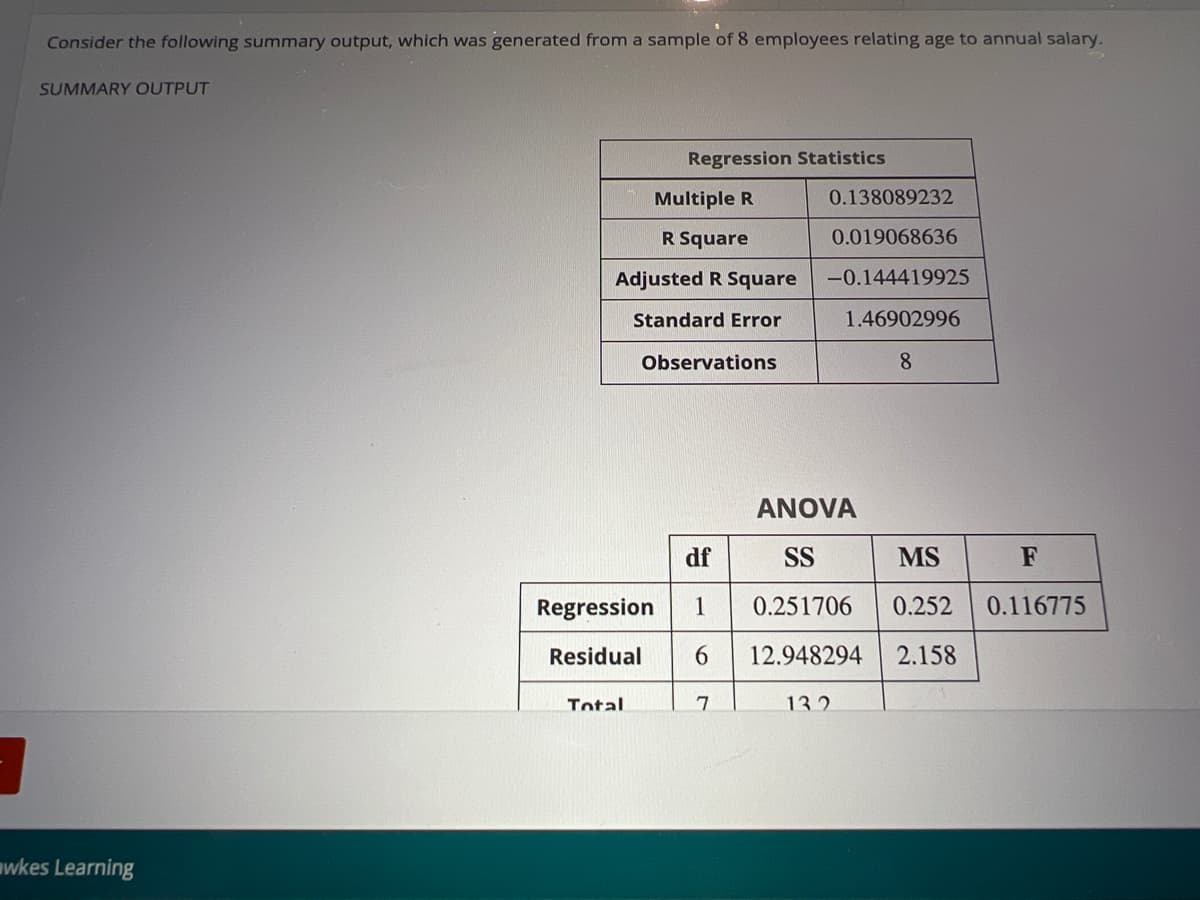
Transcribed Image Text:Consider the following summary output, which was generated from a sample of 8 employees relating age to annual salary.
SUMMARY OUTPUT
Regression Statistics
Multiple R
0.138089232
R Square
0.019068636
Adjusted R Square
-0.144419925
Standard Error
1.46902996
Observations
8.
ANOVA
df
SS
MS
F
Regression
0.251706
0.252
0.116775
Residual
6.
12.948294
2.158
Total
13.2
wkes Learning
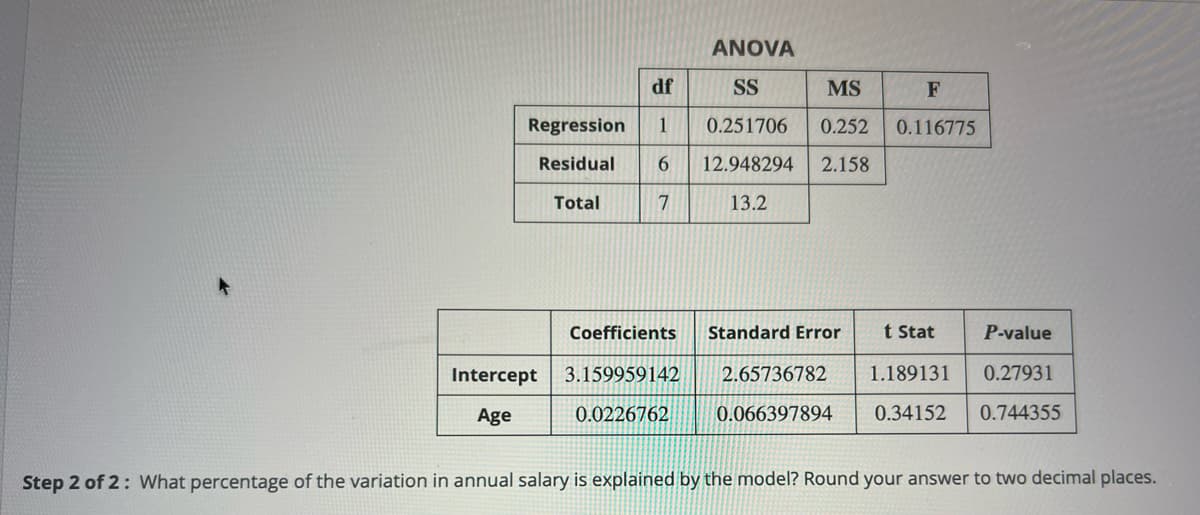
Transcribed Image Text:ANOVA
df
SS
MS
F
Regression
1
0.251706
0.252
0.116775
Residual
6.
12.948294
2.158
Total
13.2
Coefficients
Standard Error
t Stat
P-value
Intercept
3.159959142
2.65736782
1.189131
0.27931
Age
0.0226762
0.066397894
0.34152
0.744355
Step 2 of 2: What percentage of the variation in annual salary is explained by the model? Round your answer to two decimal places.
Expert Solution
This question has been solved!
Explore an expertly crafted, step-by-step solution for a thorough understanding of key concepts.

Step by step
Solved in 2 steps

Recommended textbooks for you
MATLAB: An Introduction with Applications
Statistics
ISBN:
9781119256830
Author:
Amos Gilat
Publisher:
John Wiley & Sons Inc

Probability and Statistics for Engineering and th…
Statistics
ISBN:
9781305251809
Author:
Jay L. Devore
Publisher:
Cengage Learning

Statistics for The Behavioral Sciences (MindTap C…
Statistics
ISBN:
9781305504912
Author:
Frederick J Gravetter, Larry B. Wallnau
Publisher:
Cengage Learning
MATLAB: An Introduction with Applications
Statistics
ISBN:
9781119256830
Author:
Amos Gilat
Publisher:
John Wiley & Sons Inc
Probability and Statistics for Engineering and th…
Statistics
ISBN:
9781305251809
Author:
Jay L. Devore
Publisher:
Cengage Learning
Statistics for The Behavioral Sciences (MindTap C…
Statistics
ISBN:
9781305504912
Author:
Frederick J Gravetter, Larry B. Wallnau
Publisher:
Cengage Learning

Elementary Statistics: Picturing the World (7th E…
Statistics
ISBN:
9780134683416
Author:
Ron Larson, Betsy Farber
Publisher:
PEARSON

The Basic Practice of Statistics
Statistics
ISBN:
9781319042578
Author:
David S. Moore, William I. Notz, Michael A. Fligner
Publisher:
W. H. Freeman

Introduction to the Practice of Statistics
Statistics
ISBN:
9781319013387
Author:
David S. Moore, George P. McCabe, Bruce A. Craig
Publisher:
W. H. Freeman