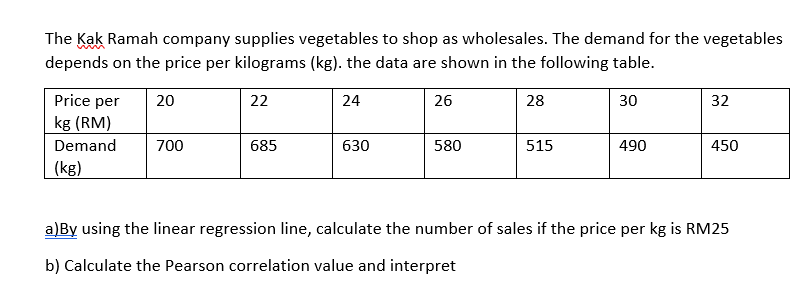
The Kak Ramah company supplies vegetables to shop as wholesales. The demand for the vegetables depends on the price per kilograms (kg). the data are shown in the following table. Price per 20 22 24 26 28 30 32 kg (RM) Demand 700 685 630 580 515 490 450 (kg) a)By using the linear regression line, calculate the number of sales if the price per kg is RM25 b) Calculate the Pearson correlation value and interpret


Q: Can you give me an example on how to write the null and alternative hypotheses and determine if each…
A: Basically, null hypothesis is the statement of a population parameter such as mean, proportion,…
Q: Twenty persons were given a blood test to determine their blood type. The data set is A А в В B АВ О…
A:
Q: 3. (Example 3) Suppose a random sample of 45 male firefighters are tested for plasma volume. The…
A: Given that x̄ = 37.5 , ? = 7.50 , Margin of error = E = 2.50 Formula for Sample Size n ≥…
Q: The reliability of two types of machines used in the same manufacturing process is to be tested. The…
A: Given , n1 = 300 , x1 = 90 , Sample proportion = p^1 = x1n1 = 90300 = 0.3 n2 = 250 , x2 = 50 ,…
Q: For the previous question, the test statistic is |TS| = _______. a 1.494 DNR H₀. Do not…
A: sample x (x-x̄)2 1 49 159.2644 2 48 185.5044 3 59 6.8644 4 52 92.5444 5 79 302.0644…
Q: 3. (Example 3) Suppose mean of x = 37.5ml/ sample size necessary mean plasma volume Fischbach).
A: Given,margin of error(E)=2.50standard deviation(σ)=7.50α=1-0.99=0.01α2=0.005Z0.005=2.58 (from…
Q: Tili Edit View History Bookmarks Window Help utoSave OFF GMH M 台90,G 回名 Draw Design Layout…
A: Here we have to identify the correct option as per given statement
Q: Do rats take the same amount of time on average than hamsters to travel through a maze? The table…
A:
Q: Suppose x has a distribution with a mean of 70 and a standard deviation of 20. Random samples of…
A: Solution
Q: uncarne dirrerent from the mean amount of airborne bacteria in uncarpeted rooms. To test this,…
A:
Q: For #1 - 9: The Psychology Department faculty are wondering whether a free tutoring program will…
A: Given that Hypothesized Population Mean (\mu)(μ) = 8585 Sample Standard Deviation (s)(s) = 77…
Q: The data in the table is the number of absences for 7 students and their corresponding grade. Number…
A:
Q: Let x be a random variable that represents the weights in kilograms (kg) of healthy adult female…
A: a) Consider that the mean and standard deviation of a random variable X are µ and σ, respectively.…
Q: 6.38 Parasitic worm. Lymphatic filariasis is a disease caused by a parasitic worm. Complications of…
A: Chi square test is a nonparametric test.
Q: FIND ME! Direction: Answer the following problems and find your answer inside the box. Write the…
A:
Q: Questions 8-12 are related to the following: Consider the following hypothesis test. Họ: u2 120 H1:…
A:
Q: An article in Air and Waste ["Update on Ozone Trends in California's South Coast Air Basin" (Vol.…
A: Given Information: Consider the given data: Days (X) Index (Y) 91 16.7 105 17.1 106 18.2…
Q: Find the mean: Find the median: Find the standard deviation:
A: We have to calculate the mean, median and standard deviation of given data. First we have to sort…
Q: Are you smarter than a second-grader? A random sample of 55 second-graders in a certain school…
A: Given that Hypothesized Population Mean (\mu)(μ) = 5151 Population Standard Deviation…
Q: Here is a data set that has a nearly normal distribution. data data data data 47.36 36.38 41.34…
A: Frequency distribution is an way of arranging data in meaningful way.
Q: Manatees are one creature found in coastal waterways. 10 years ago, researchers concluded that the…
A: Assume that μ is the true mean weight of manatees 10 years ago.
Q: For #1 - 9: The Psychology Department faculty are wondering whether a free tutoring program will…
A: The random variable X follows normal distribution. We have to find the value of the test statistic.…
Q: Marketers believe that 92% of adults in the United States own a cell phone. A cell phone…
A: For the given data perform z test for one proportion test
Q: 2. (Example 2): At a test site in Great Sand Dunes National Park, Colorado, the prevailing wind did…
A: Given Sample mean x̄=1075, standard deviations σ=265, n=60 Moe=margin of error=75
Q: 14. 4 1 P(x) - 7. 117 117 117 3117 2117 117
A:
Q: In standard normal distribution, what is the area to the left of z = -2.22 ? A 0.9830 B 0.0132…
A: In standard normal distribution,what is the area to the
Q: FIND ME! Direction: Answer the following problems and find your answer inside the box. Write the…
A:
Q: 15. 1 P(x) .30 .70 2.
A: Let X be the random variable having probability mass function is, X 1 3 P(x) 0.30 0.79…
Q: Example 3.3: Calculate the mean, median, and mode for the following data. Number of people Age 17 -…
A:
Q: If Linear correlation coefficient r = 0.794556 Coefficient of determination = 0.631319 Equation of…
A: We have given that Linear correlation coefficient r = 0.794556 Coefficient of determination =…
Q: Prior to testing the patch, each of the patients (n = 7) rated their current level of back pain on a…
A: Given that; From the table firstly find difference and by using paired t test. Find other parts.
Q: 1. A prankster has deleted the values in the table below for people's favorite baby animal out of…
A:
Q: 0.35 0.30 8. 0.15 0.15 0.60 7. 0.25 10 0.10 12 0.25 14 0.35 16 0.25 18 0.05 8. 0.65 10 0.35 sheet…
A: *Answer:
Q: According to an article nearly 45% of all Americans have brown eyes. A random sample of 100 people…
A: Given that Sample size n =100 Favorable cases x =32 Sample proportion p^=x/n =32/100 =0.32
Q: Determine whether the given value of X is an outlier, extreme outlier, or not of the following set…
A: Given that The data is normally distributed. Mean (μ) = 33.1 Standard deviation (σ) = 7.4 We…
Q: What percent of the total population is found between the mean and the z-score given? (Use the…
A: Solution
Q: The average life span of 360 people is recorded to be normally distributed with a mean of 65 years…
A:
Q: Question 22 If the lower limit of a class is 17 and the class midpoint is 20.5, what is the upper…
A:
Q: What is the area to the right of the z-score -2.26? 0.0119 0.5119 0.9881 0.4881
A: The area to the right of the z-score is -2.26
Q: 12% of all Americans suffer from sleep apnea. A researcher suspects that a higher percentage of…
A: Note: If the post contains multiple subparts only allow to do first 3 or 4 subparts as per…
Q: 3. (Example 3) Suppose a random sample of 45 male firefighters are tested for plasma volume. The…
A:
Q: A manufacturing company that produces laminate for countertops is interested in studying the…
A: Given that
Q: Find the probability that a British nurse selected at random in 1851 would be 60 years of age or…
A: Given that Age range (yr) 20-29 30-39 40-49 50-59 60-69 70-79 80+ Midpoint x 24.5 34.5 44.5…
Q: The following results are for independent random samples taken from two populations. Suppose that we…
A:
Q: Y 1 2 14 The analyst now wishes to determine whether this is a good or bad model. To do this, she…
A: Since you have posted a question with multiple subparts, we will solve first three subparts for you.…
Q: Question 2 Suppose that we have two SRSS from two distinct populations. From the first sample we…
A: Given that ; With the help of given information we solve this problem by using two sample mean z…
Q: The Ministry of Health is interested in determining whether the average nicotine content of regular,…
A: Since there are many parts, I solved (a) to (d) as per Bartleby rules. Please post the remaining…
Q: The following table contains the number of successes and failures for three categories of a…
A: For the given data perform chi square test
Q: A survey was conducted among students from a university and the respondents were asked how many…
A: Given that The data are 143,145,97,120,143,135,100,67,45,112,108,120,154,132,86,530,450,312,190,211
Q: 39. What is the average value expected for the Independent-Measures t-statistic if the null…
A: We have given that The average value expected for the independent- Measures t-shirts statistic if…

Step by step
Solved in 4 steps with 1 images

- Olympic Pole Vault The graph in Figure 7 indicates that in recent years the winning Olympic men’s pole vault height has fallen below the value predicted by the regression line in Example 2. This might have occurred because when the pole vault was a new event there was much room for improvement in vaulters’ performances, whereas now even the best training can produce only incremental advances. Let’s see whether concentrating on more recent results gives a better predictor of future records. (a) Use the data in Table 2 (page 176) to complete the table of winning pole vault heights shown in the margin. (Note that we are using x=0 to correspond to the year 1972, where this restricted data set begins.) (b) Find the regression line for the data in part ‚(a). (c) Plot the data and the regression line on the same axes. Does the regression line seem to provide a good model for the data? (d) What does the regression line predict as the winning pole vault height for the 2012 Olympics? Compare this predicted value to the actual 2012 winning height of 5.97 m, as described on page 177. Has this new regression line provided a better prediction than the line in Example 2?The monthly premium quoted by an insurance company for a critical illness policy was collected from a sample of 6 adult male smokers at different age. The data for the sample are shown: Age 28 25 50 39 47 31 Premium ($) 75 40 175 125 250 105 Using Age to predict premium, the Linear Regression equation is given by: ŷ =6.556X−112 and r2=0.813y^=6.556X−112 and r2=0.813 a. Identify the independent and Dependent variables. Dependent: Age Premium Independent: Age Premium b. Determine the slope. Slope = Slope = Round to 3 decimal places c. Determine |r||r| . |r|=|r|= Round to 3 decimal places d. Interpret rr : and e. Determine critical r value at 5% significance level and determine if there is a significant linear correlation exists. |r| critical=|r| critical= Round to 3 decimal places Linear Correlation:Linear Correlation: Significant Not Significant f. Predict the monthly premium for a 40 years old adult male smoker.…The owner of Showtime Movie Theaters, Inc., would like to predict weekly gross revenueas a function of advertising expenditures. Historical data for a sample of eight weeks follow. Weekly GrossRevenue($1000s) Television Advertising($1000s) Newspaper Advertising($1000s) 96 5.0 1.5 90 2.0 2.0 95 4.0 1.5 92 2.5 2.5 95 3.0 3.3 94 3.5 2.3 94 2.5 4.2 94 3.0 2.5 a. Develop an estimated regression equation with the amount of televisionadvertising as the independent variable.b. Develop an estimated regression equation with both television advertising and newspaper advertising as the independent variables. c. Is the estimated regression equation coefficient for television advertisingexpenditures the same in part (a) and in part (b)? Interpret the coefficient in each case. d. Predict weekly gross revenue for a week when $3500 is spent on television advertising and $1800 is spent on newspaper advertising.
- The owner of Original Italian Pizza restaurant chain wants to understand which variable most strongly influences the sales of his specialty deep-dish pizza. He has gathered data on the monthly sales of deep-dish pizzas at his restaurants and observations on other potentially relevant variables for each of several outlets in central Indiana. These data are provided in the file P10_04.xlsx. Estimate a simple linear regression equation between the quantity sold (Y) and each of the following candidates for the best explanatory variable: average price of deep-dish pizzas (X1), monthly advertising expenditures (X2), and disposable income per household in the areas surrounding the outlets (X3). Round your answers for intercept coefficients to the nearest whole number and slope coefficients to two decimal places, if necessary. If your answer is negative number, enter "minus" sign.A medical researcher wishes to determine how the dosage (in milliliters) of an experimental drugaffects the heart rate (in beats per minute) of patients with an elevated heart rate. The data for asample of eight patients with an elevated heart rate are provided in the following table.Drug Dosage 0 5 10 20 25 30 40 50Heart Rate 135 124 106 89 85 72 68 62(a) Determine the linear regression model that will best predict a patient’s heart rate based on thedosage of the drug received. (b) How well does the linear regression model fit this sample data? (c) If a patient with an elevated heart rate is administered a 35 ml dose of this drug, predict theresulting heart rate of the patient.A company that holds the DVD distribution rights to movies previously released only in theaters wants to estimate sales revenue of DVDs based on box office success. The box office gross (in Php millions) for each of 22 movies in the year that they were released and the DVD revenue (in Php millions) in the following year are shown below and stored in a. construct a scatter plot. b. assuming a linear relationship, use the least-squares method to determine the regression coefficients b0 and b c. interpret the meaning of the slope, in this problem d. predict the sales revenue for a movie DVD that had a box office gross of Php75 million..1
- The data regarding the production of wheat in tons (X) and the price of the kilo of flour in Ghana cedis (Y) Takoradi some years ago were: a. Fit the regression line for the day using the method of least squaresA mail-order business selling personal computer supplies, software and hardware maintains a centralized warehouse. Management is currently examining the process of distribution from the warehouse and wants to study the factors that affect the warehouse distribution costs. Data collected over 24 random months contain the warehouse’s distribution cost (in thousands of Rands), the sales (in thousands of Rands) and the number of orders received. A multiple linear regression model was fitted to the data by using Stat1.2. Use the output to answer the questions that follow by typing only the letter of the correct option in the answer boxes. Variablesy: Warehouse Distribution Costx1: Salesx2: Number of Orders Model Fitting StatisticsR2 = 0.8504Adj R2: ? Regression Coefficients Beta Parameter Standard b Parameter Standard Estimates…The table below shows the average weekly wages (in dollars) for state government employees and federal government employees for 10 years. Construct and interpret a 95% prediction interval for the average weekly wages of federal government employees when the average weekly wages of state government employees is $841. The equation of the regression line is ModifyingAbove .y=1.403x+9.259. Wages (state), x 724 747 800 803 839 897 901 939 951 956 Wages (federal), y 1,035 1,060 1,111 1,144 1,190 1,245 1,276 1,306 1,332 1,396 Construct and interpret a 95% prediction interval for the average weekly wages of federal government employees when the average weekly wages of state government employees is $841. Select the correct choice below and fill in the answer boxes to complete your choice. (Round to the nearest cent as needed.) A. There is a 95% chance that the predicted average weekly wages of federal government…
- King & Scott, a research firm for the real estate industry, studied the relation between x=x= annual income (in thousands of dollars) and y=y= sale price of house purchased (in thousands of dollars). A random sample of data was collected from mortgage applications for home sales in the region of the study, and is given in the table. Annual Income House Price 72 188 48 91.6 73 182.2 97 155.5 97 238.8 94 203.4 67 160.1 85 212 64 169 Conduct a linear regression. Use the results to answer the following questions. a. What is the value of the correlation coefficient (round to 3 decimal places)? What does the value tell you about the linear relationship between the annual income and the price of house purchased? Correlation coefficient: This indicates: very weak positive linear correlation fairly strong negative linear correlation perfect positive linear correlation very weak negative linear correlation perfect negative linear correlation no linear…An agronomist undertook an experiment to investigate the factors that potato harvest. In his research, agronomist decided to divide the farm into 30 half hectare plots and apply varies level of fertilizer. Potato was then planted and the harvest at the end of the season was recorded. Fertilizer(Kg) Harvest (tons) 210 43.5 220 40.0 230 48.0 240 65.0 250 80.0 260 85.0 270 95.0 280 80.0 290 97.3 1. Find the simple regression line and interpret the coefficients. 2. Find the coefficient of determination and interpret its value. 3. Does the model appear to be a useful tool in predicting the potato harvest? If so, predict the harvest when 250KG of fertilizer is applied. If not explain why not.The owner of Showtime Movie Theaters, Inc., would like to estimate weekly gross revenue as a function of advertising expenditures. Historical data for a sample of eight weeks follows: Weekly Revenue (£1000s) Television advertising (£1000s) Newspaper advertising (£1000s) 96 5 1.5 90 2 2 95 4 1.5 92 2.5 2.5 95 3 3.3 94 3.5 2.3 94 2.5 4.2 94 3 2.5 a) Calculate the correlation coefficient among the variables and explain the result. b) Plot two simple linear regression equations- i) television advertising as independent variable and weekly revenue as dependent variable ii) newspaper advertising as the independent variable and weekly revenue as dependent variable. You would be using Excel Data Analysis Pack – Regression to get the relationship; c) Create scatter diagrams for each linear relationship and display the linear regression equation and R square value on chart.


