The least-squares regression equation is y = 650.9x+ 16,443 where y is the median income and x is the percentage of 25 years and older with at least a bachelor's degree in the region. The scatter diagram indicates a linear relation between the two variables with a correlation 55000- coefficient of 0.7174. Complete parts (a) through (d). 25000- 15 20 25 30 35 40 45 50 55 60 Bachelor's % ..... (c) Interpret the slope. Select the correct choice below and fill in the answer box to complete your choice. (Type an integer or decimal. Do not round.) O A. For 0% of adults having a bachelor's degree, the median income is predicted to be $ B. For a median income of $0, the percent of adults with a bachelor's degree is %. O C. For every dollar increase in median income, the percent of adults having at least a bachelor's degree is %, on average. D. For every percent increase in adults having at least a bachelor's degree, the median income increases by $ , on average. Median Income
The least-squares regression equation is y = 650.9x+ 16,443 where y is the median income and x is the percentage of 25 years and older with at least a bachelor's degree in the region. The scatter diagram indicates a linear relation between the two variables with a correlation 55000- coefficient of 0.7174. Complete parts (a) through (d). 25000- 15 20 25 30 35 40 45 50 55 60 Bachelor's % ..... (c) Interpret the slope. Select the correct choice below and fill in the answer box to complete your choice. (Type an integer or decimal. Do not round.) O A. For 0% of adults having a bachelor's degree, the median income is predicted to be $ B. For a median income of $0, the percent of adults with a bachelor's degree is %. O C. For every dollar increase in median income, the percent of adults having at least a bachelor's degree is %, on average. D. For every percent increase in adults having at least a bachelor's degree, the median income increases by $ , on average. Median Income

College Algebra
7th Edition
ISBN:9781305115545
Author:James Stewart, Lothar Redlin, Saleem Watson
Publisher:James Stewart, Lothar Redlin, Saleem Watson
Chapter1: Equations And Graphs
Section: Chapter Questions
Problem 10T: Olympic Pole Vault The graph in Figure 7 indicates that in recent years the winning Olympic men’s...

Related questions
Question
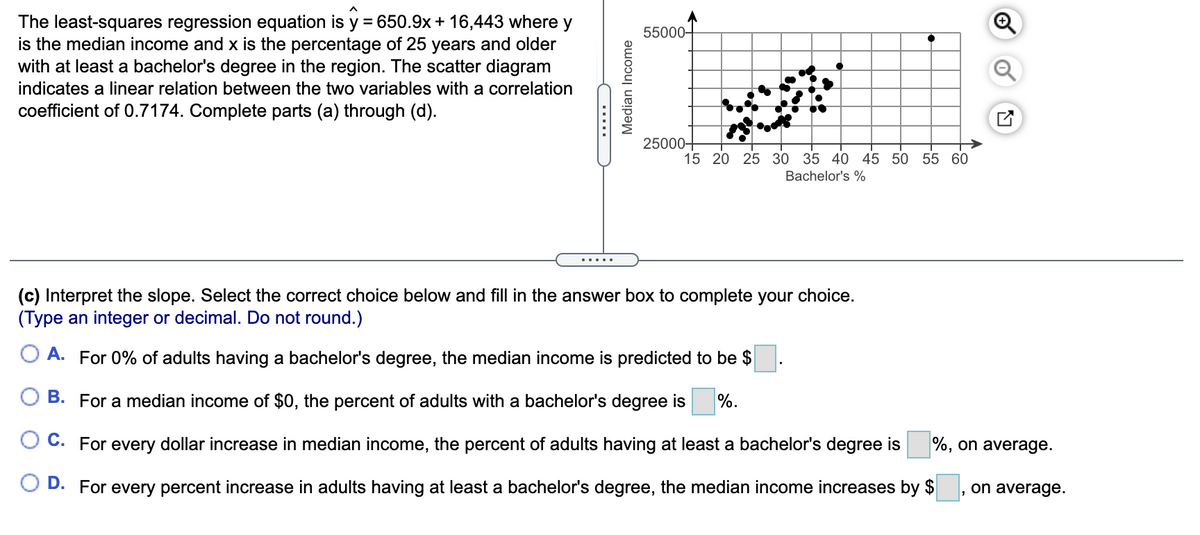
Transcribed Image Text:The least-squares regression equation is y = 650.9x + 16,443 where y
is the median income and x is the percentage of 25 years and older
with at least a bachelor's degree in the region. The scatter diagram
55000-
indicates a linear relation between the two variables with a correlation
coefficient of 0.7174. Complete parts (a) through (d).
25000-
15 20 25 30 35 40 45 50 55 60
Bachelor's %
(c) Interpret the slope. Select the correct choice below and fill in the answer box to complete your choice.
(Type an integer or decimal. Do not round.)
A. For 0% of adults having a bachelor's degree, the median income is predicted to be $
B. For a median income of $0, the percent of adults with a bachelor's degree is
%.
O C. For every dollar increase in median income, the percent of adults having at least a bachelor's degree is
%, on average.
O D. For every percent increase in adults having at least a bachelor's degree, the median income increases by $
, on average.
Median Income
of
Expert Solution
This question has been solved!
Explore an expertly crafted, step-by-step solution for a thorough understanding of key concepts.

This is a popular solution!

Trending now
This is a popular solution!

Step by step
Solved in 2 steps

Recommended textbooks for you
College Algebra
Algebra
ISBN:
9781305115545
Author:
James Stewart, Lothar Redlin, Saleem Watson
Publisher:
Cengage Learning

Algebra & Trigonometry with Analytic Geometry
Algebra
ISBN:
9781133382119
Author:
Swokowski
Publisher:
Cengage

Algebra and Trigonometry (MindTap Course List)
Algebra
ISBN:
9781305071742
Author:
James Stewart, Lothar Redlin, Saleem Watson
Publisher:
Cengage Learning
College Algebra
Algebra
ISBN:
9781305115545
Author:
James Stewart, Lothar Redlin, Saleem Watson
Publisher:
Cengage Learning
Algebra & Trigonometry with Analytic Geometry
Algebra
ISBN:
9781133382119
Author:
Swokowski
Publisher:
Cengage
Algebra and Trigonometry (MindTap Course List)
Algebra
ISBN:
9781305071742
Author:
James Stewart, Lothar Redlin, Saleem Watson
Publisher:
Cengage Learning


Glencoe Algebra 1, Student Edition, 9780079039897…
Algebra
ISBN:
9780079039897
Author:
Carter
Publisher:
McGraw Hill

Trigonometry (MindTap Course List)
Trigonometry
ISBN:
9781305652224
Author:
Charles P. McKeague, Mark D. Turner
Publisher:
Cengage Learning