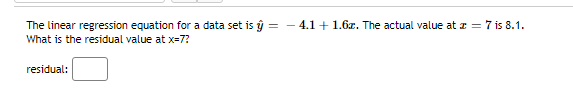
The linear regression equation for a data set is ĝ = 4.1 + 1.6z. The actual value at z = 7 is 8.1. What is the residual value at x=7? residual:


Q: More cereal Exercise 1 describes a regression model thatestimates a cereal’s potassium content from…
A: In a regression analysis, the regression model describes the estimates of a cereal’s potassium…
Q: A pamphlet published by AAA gave the following information on vehicle speed (in miles per hour) and…
A:
Q: he following estimated regression model was developed relating yearly income (y in $1000s) of 30…
A: Given : ŷ = 30 + 0.7x1 + 3x2 Here x1 = 24 and x2 = 1
Q: In a simple linear regression you are told that the estimate of the slope coefficient was 0.5 and…
A: Given data, test statistic (t) = -2.5 slope (b1) = 0.5
Q: Use the pizza cost and the subway fare in the table below to find the regression equation, letting…
A: The provided information is Pizza cost (x) Subway Fare (y) xy x2 0.152 0.148 0.022496 0.023104…
Q: An article reported that for a regression of y = average SAT score on x = expenditure per pupil,…
A: The regression equation obtained is y^=766+0.015x where, y: Average SAT scorex: Expenditure per…
Q: ($1,000s) ($1,000s) ($1,000s) 104 5.0 1.5 90 2.0 2.0 95 4.0 1.5 92 2.5 2.5 100 3.0 3.3 94 3.5 2.3 94…
A: In this TVAdv, NVAdv are the independent variable and Weekly Gross Revenue is the dependent…
Q: A regression between foot length (y) ( in cm) and height (x) ( in inches) for 33 students resulted…
A: regression between foot length (y) ( in cm) and height (x) ( in inches) for 33 students resulted in…
Q: 1. Is it possible to predict the mass of an Atlantic Ocean rockfish from its length? A sample of…
A: Note: Hey, since there are multiple questions posted, we will answer first question. If you want any…
Q: The U.S. Postal Service is attempting to reduce the number of complaints made by the public against…
A: Given regression results
Q: 9. In a simple regression, which would suggest a significant relationship between X and Y? A) Large…
A: In regression analysis, the slope (b) tells us the direction of the linear relationship between the…
Q: 4. Y = 0.43X + 1.1; X = 0.97 5. Y = X +:X = 6. Assume that the height of fathers (X) and the height…
A:
Q: A set of n = 25 pairs of X and Y values has a correlation of r = -0.50 with SSX = 38 and SSY = 14.…
A: Given, n = 25 r = -0.50 SSX = 38 SSY = 14
Q: A group of students measure the length and width of a random sample of beans. They are interested in…
A: d) Compute the slope of the regression line using the formula: b=rsysx Where, 'b' is the estimated…
Q: In a simple linear regression you are told that the estimate of the slope coefficient was 0.9 and…
A: Obtain the estimated standard error for the estimated slope coefficient. The estimated standard…
Q: The following estimated regression model was developed relating yearly income (Y in $1,000s) of 30…
A:
Q: please show work and fill in the blank
A:
Q: A group of students measure the length and width of a random sample of beans. They are interested in…
A: d) Compute the estimated slope of the regression line using the formula: b=rsysx Where, 'b' is the…
Q: 1a. Develop an estimated regression equation for these data. 1b. Compute the residuals and…
A: The regression output obtained in excel is as follows Coefficients Standard Error t Stat…
Q: 15. The following calculations have been made for the price of 12 stocks (X) on BSE on a certain day…
A: Since you have asked multiple question, we will solve the first question for you. If you want any…
Q: A regression line for a set of data is calculated and found to be y^=85+12x. Use this to predict…
A:
Q: The regression equation below was estimated using a random sample of 27 pairs of X, y observations.…
A:
Q: Find out the regression equation showing the regression of capacity utilisation on production from…
A: X-35.6 GivenThe dependent variable (y) is Capacity Utilisation and independent variable(x) is…
Q: Working as a professor, I may want to try and predict success on a final exam by student success on…
A: The independent variable is first exam score. The dependent variable is final exam score. We have to…
Q: The coefficient of correlation between calories and fat content in burgers is found to be 0.88.…
A: Solution-: Given: The coefficient of correlation between calories and fat content in burgers is…
Q: Assume that there is a positive linear correlation between the variable R (return rate in percent of…
A: Correlation Coefficient: It is one of the statistical measures. It is used between any…
Q: The following estimated regression model was developed relating yearly income (y in $1000s) of 30…
A: The given regression equation is ŷ = 30 + 0.7x1 + 3x2 We need to find the income of a 24-year old…
Q: A set of n=20 pairs of x and y scores had SSx=10,SSy=40,and SP=30.What is the slope for the…
A: Given : n=20SSx=10SSy=40SP=30We want to find, the value of slop for regression equation for…
Q: a. Find the sum of Y^2: b. Find the Correlation coefficient: c. Estimate the slope of the regression…
A: Given, Group X Y A 1 2 B 2 2 C 8 2 D 1 6 E 1 4 Let r be correlation coefficient Let…
Q: A reporter was interested in the relationship between the size of a dining party and the amount of…
A: From the above graph The interpretation of the graph is below picture
Q: Consider the data in the table below. Y X 4 3 6 1. In the space below (or on a separate sheet of…
A: The table shows and x and y values.
Q: Q2. Why do we have in general, two lines of regression? Obtain the regression of Y on X and X on Y…
A:
Q: Consider the data in the table below. X 1 5 4 8 3 2 1 7 2)| The slope coefficient for a regression…
A: As per our guidelines we can solve first three sub part of question and rest can be reposted.…
Q: t is the test statistic to test the significance of the slope in a regression equation?
A: The test statistic to test the significance of the slope in a regression equation. We know that…
Q: The regression equation is Ý = 29.29 – 0.96X, the sample size is 8, and the standard error of the…
A: Given that Sample size n = 8 Standard error of slope = 0.22 Level of significance = 0.01
Q: A random sample of records of home sales from March 1 to July 1, 2010 from the files maintained by…
A: Regression equation Y=Intercept +slope. X Whre Y is predicted price X is size
Q: The estimated regression equation for a model involving two independent variables and 65…
A: y^ = β0 + β1x
Q: For the data given below from a simple linear regression model, the computed value of the sum square…
A: The formula of SSE is,
Q: 5. Find the regression equation for predicting weight from height for men age 18-24 in HANESS, based…
A: Let X represents height and Y represents weight. Then x̄= 70 , ȳ= 180 Sxx= 3 and Syy= 45…
Q: The following estimated regression model was developed relating yearly income (y in $1000s) of 30…
A: given regression model, ŷ = 30 + 0.7x1 + 3x2 x1 represents the age x2 represenst the gender (0…
Q: observations get closer and more concentrated around the estimated regression line, what happens to…
A: Here Coefficient of determination = R2 represent how much of data fitted in regression model
Q: A sample consists of 500 houses sold in Karachi between January 2020 and December 2020. The multiple…
A: As we can wee in the output, the value of R square is 0.67, which shows that the data is not a good…
Q: X 06 23 3 C
A: Introductionxyx⋅yx⋅x=x206001221236431394x=100016∑y=120∑x⋅y16∑x2=30
Q: Based on the following regression equation of teenage BMI, which one is the estimated BMI for a…
A:
Q: Working as a professor, I may want to try and predict success on a final exam by student success on…
A: (1) Use EXCEL to obtain the value correlation coefficient r: EXCEL procedure: Go to EXCEL Go to…
Q: Y X2 X3 140 4 8 260 6 12 350 7 10 470 10 5 590 13 10
A: Use the following formulae, to find the multiple linear regression equation with two independent…
Q: The following data show, in convenient units, the yield Y of a chemical reaction run at various…
A:
Q: In a simple linear regression you are told that the estimate of the slope coefficient was 0.9 and…
A: Given, t-statistic = -3.6 Testing whether slope parameter = 1 or not Estimated slope coefficient =…
Q: The mortality rate of a sample of the population as a function of daily tobacco consumption can be…
A: Given data :
Q: A fitted linear regression model is (y=10+2x ). If x = 0 and the corresponding observed value of y =…
A: Given,regression model is y^=10+2x if x=0 and the corresponding observed value of y=9

Step by step
Solved in 2 steps with 2 images

- Olympic Pole Vault The graph in Figure 7 indicates that in recent years the winning Olympic men’s pole vault height has fallen below the value predicted by the regression line in Example 2. This might have occurred because when the pole vault was a new event there was much room for improvement in vaulters’ performances, whereas now even the best training can produce only incremental advances. Let’s see whether concentrating on more recent results gives a better predictor of future records. (a) Use the data in Table 2 (page 176) to complete the table of winning pole vault heights shown in the margin. (Note that we are using x=0 to correspond to the year 1972, where this restricted data set begins.) (b) Find the regression line for the data in part ‚(a). (c) Plot the data and the regression line on the same axes. Does the regression line seem to provide a good model for the data? (d) What does the regression line predict as the winning pole vault height for the 2012 Olympics? Compare this predicted value to the actual 2012 winning height of 5.97 m, as described on page 177. Has this new regression line provided a better prediction than the line in Example 2?Table 6 shows the population, in thousands, of harbor seals in the Wadden Sea over the years 1997 to 2012. a. Let x represent time in years starting with x=0 for the year 1997. Let y represent the number of seals in thousands. Use logistic regression to fit a model to these data. b. Use the model to predict the seal population for the year 2020. c. To the nearest whole number, what is the limiting value of this model?For the following exercises, use Table 4 which shows the percent of unemployed persons 25 years or older who are college graduates in a particular city, by year. Based on the set of data given in Table 5, calculate the regression line using a calculator or other technology tool, and determine the correlation coefficient. Round to three decimal places of accuracy
- What does the y -intercept on the graph of a logistic equation correspond to for a population modeled by that equation?For the following exercises, use Table 4 which shows the percent of unemployed persons 25 years or older who are college graduates in a particular city, by year. Determine whether the trend appears linear. If so, and assuming the trend continues, find a linear regression model to predict the percent of unemployed in a given year to three decimal places.For the following exercises, consider the data in Table 5, which shows the percent of unemployed in a city ofpeople25 years or older who are college graduates is given below, by year. 41. Based on the set of data given in Table 7, calculatethe regression line using a calculator or othertechnology tool, and determine the correlationcoefficient to three decimal places.
- For the following exercises, consider the data in Table 5, which shows the percent of unemployed ina city of people 25 years or older who are college graduates is given below, by year. 40. Based on the set of data given in Table 6, calculate the regression line using a calculator or other technology tool, and determine the correlation coefficient to three decimal places.The following fictitious table shows kryptonite price, in dollar per gram, t years after 2006. t= Years since 2006 0 1 2 3 4 5 6 7 8 9 10 K= Price 56 51 50 55 58 52 45 43 44 48 51 Make a quartic model of these data. Round the regression parameters to two decimal places.For the following exercises, consider the data in Table 5, which shows the percent of unemployed in a city of people 25 years or older who are college graduates is given below, by year. 38. Determine whether the trend appears to be linear.If so, and assuming the trend continues, find alinear regression model to predict the percent of unemployed in a given year to three decimal places.
- For the following exercises, consider this scenario: The profit of a company decreased steadily overa ten-year spam.The following ordered pairs shows dollars and the number of units sold in hundreds and the profit in thousands ofover the ten-year span, (number of units sold, profit) for specific recorded years: (46,600),(48,550),(50,505),(52,540),(54,495). Use linear regression to determine a function Pwhere the profit in thousands of dollars depends onthe number of units sold in hundreds.Table 2 shows a recent graduate’s credit card balance each month after graduation. a. Use exponential regression to fit a model to these data. b. If spending continues at this rate, what will the graduate’s credit card debt be one year after graduating?Use the table of values you made in part 4 of the example to find the limiting value of the average rate of change in velocity.


