The local government in Leeds is worried about the increasing amount of waste households in its city are producing. In order to gain a better understanding of what factors influence the amount of waste each household produces, consultants have gathered data from a random sample of 400 households on their average weekly waste, alongside information on the number of people living in the household, household income, whether anyone in the household works from home and whether the household has signed up to the ‘Make Leeds Greener’ initiative. The consultants have provided you with the following OLS output and asked you to provide a full discussion and interpretation of the statistical output.


The local government in Leeds is worried about the increasing amount of waste households in its city are producing. In order to gain a better understanding of what factors influence the amount of waste each household produces, consultants have gathered data from a random sample of 400 households on their average weekly waste, alongside information on the number of people living in the household, household income, whether anyone in the household works from home and whether the household has signed up to the ‘Make Leeds Greener’ initiative. The consultants have provided you with the following OLS output and asked you to provide a full discussion and interpretation of the statistical output.
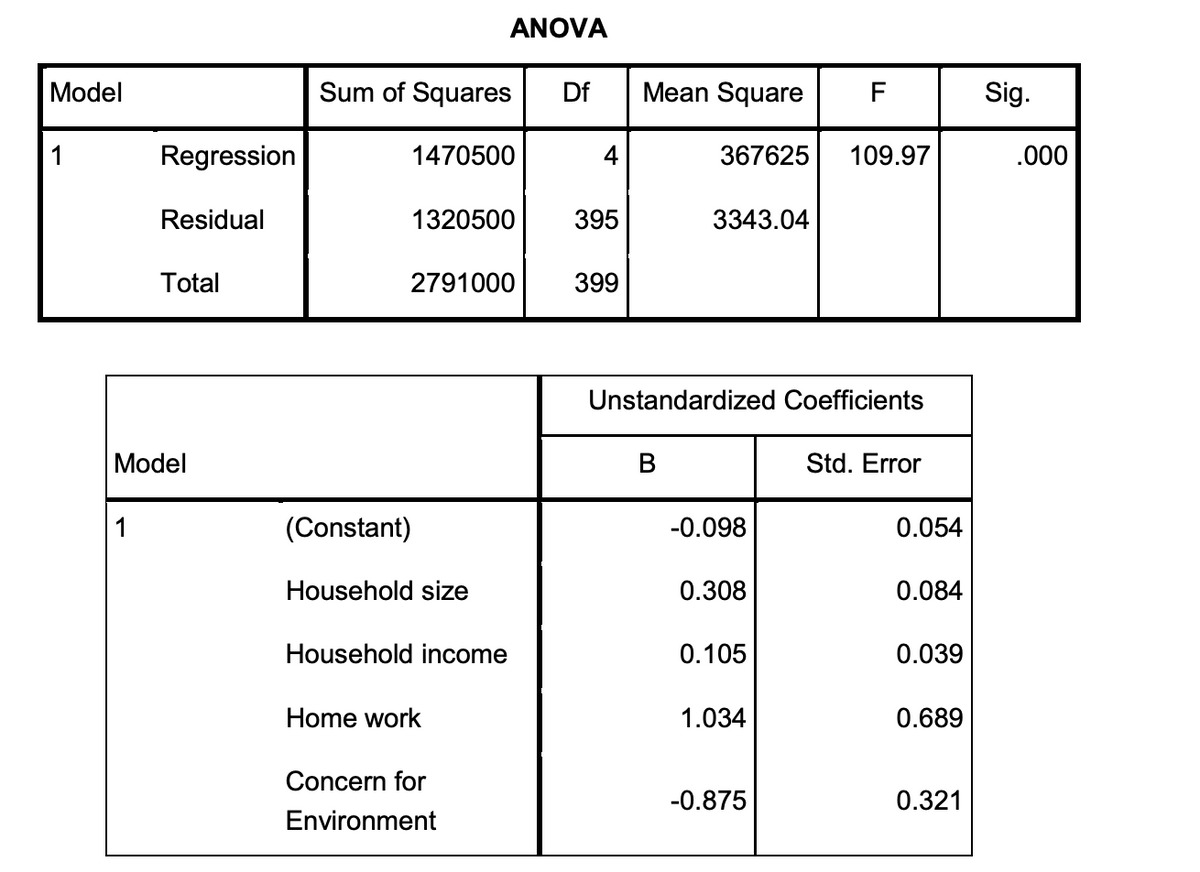
Where the dependent variable:
Household average weekly waste (kgs) and the independent variables are:
Household size - number of people living in the household; Household Income - salary in £000’s;
Home work - someone working from home (1) ; no one working from home (0);
Concern for Environment - member of ‘Make Leeds Greener’ (1); not a member (0).
You are asked to answer the following questions:
i. Explain what the F-test is testing for in multiple regression models. Interpret the relevant evidence in the OLS output.
ii. Use the information above to calculate the R2 statistic. Explain your findings.
iii. Which of the explanatory variables are ‘statistically significant’ at the 1% level of significance and which are not? Explain the ‘test’ have you used to establish this and explain what it is testing for.
iv. Give a full written interpretation of each coefficient estimate.
v. What is multicollinearity and what are its consequences?
vi. If the tolerance/VIF value on the household income variable is 0.32/3.13, explain what this value means?

Step by step
Solved in 3 steps


