The local utility company surveys 19 randomly selected customers. For each survey participant, the company collects the following: annual electric bill (in dollars) and home size (in square feet). Output from a regression analysis is as follows: bill 11.45 +3.26 size. Coefficients Estimate Std. Error (Intercept) Size 11.45 3.26 0.83 0.35 Round your answer to three decimal places, and round any interim calculations to four decimal places. We are 99% confident that the mean annual electric bill increases by between dollars for every additional square foot in home size. dollars and
The local utility company surveys 19 randomly selected customers. For each survey participant, the company collects the following: annual electric bill (in dollars) and home size (in square feet). Output from a regression analysis is as follows: bill 11.45 +3.26 size. Coefficients Estimate Std. Error (Intercept) Size 11.45 3.26 0.83 0.35 Round your answer to three decimal places, and round any interim calculations to four decimal places. We are 99% confident that the mean annual electric bill increases by between dollars for every additional square foot in home size. dollars and

Chapter4: Linear Functions
Section: Chapter Questions
Problem 30PT: For the following exercises, use Table 4 which shows the percent of unemployed persons 25 years or...

Related questions
Question
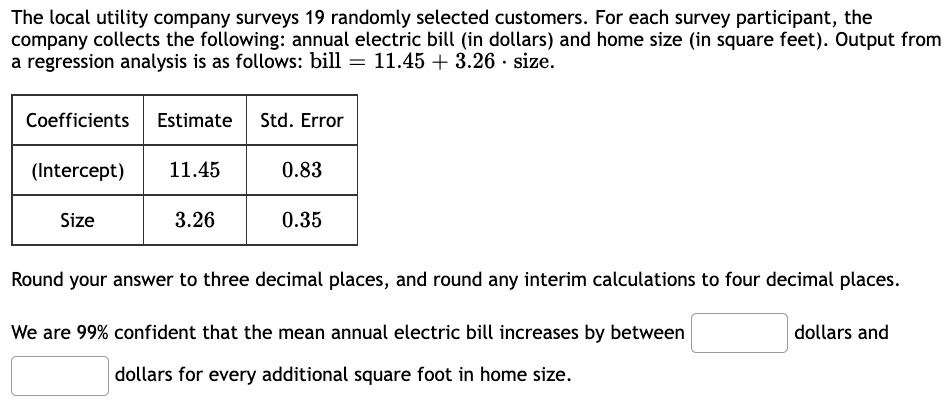
Transcribed Image Text:The local utility company surveys 19 randomly selected customers. For each survey participant, the
company collects the following: annual electric bill (in dollars) and home size (in square feet). Output from
a regression analysis is as follows: bill 11.45 +3.26 size.
Coefficients Estimate Std. Error
(Intercept)
Size
11.45
3.26
0.83
0.35
Round your answer to three decimal places, and round any interim calculations to four decimal places.
We are 99% confident that the mean annual electric bill increases by between
dollars for every additional square foot in home size.
dollars and
Expert Solution
This question has been solved!
Explore an expertly crafted, step-by-step solution for a thorough understanding of key concepts.

Step by step
Solved in 2 steps with 1 images

Recommended textbooks for you

Linear Algebra: A Modern Introduction
Algebra
ISBN:
9781285463247
Author:
David Poole
Publisher:
Cengage Learning

Glencoe Algebra 1, Student Edition, 9780079039897…
Algebra
ISBN:
9780079039897
Author:
Carter
Publisher:
McGraw Hill
Linear Algebra: A Modern Introduction
Algebra
ISBN:
9781285463247
Author:
David Poole
Publisher:
Cengage Learning
Glencoe Algebra 1, Student Edition, 9780079039897…
Algebra
ISBN:
9780079039897
Author:
Carter
Publisher:
McGraw Hill

Algebra and Trigonometry (MindTap Course List)
Algebra
ISBN:
9781305071742
Author:
James Stewart, Lothar Redlin, Saleem Watson
Publisher:
Cengage Learning

Functions and Change: A Modeling Approach to Coll…
Algebra
ISBN:
9781337111348
Author:
Bruce Crauder, Benny Evans, Alan Noell
Publisher:
Cengage Learning