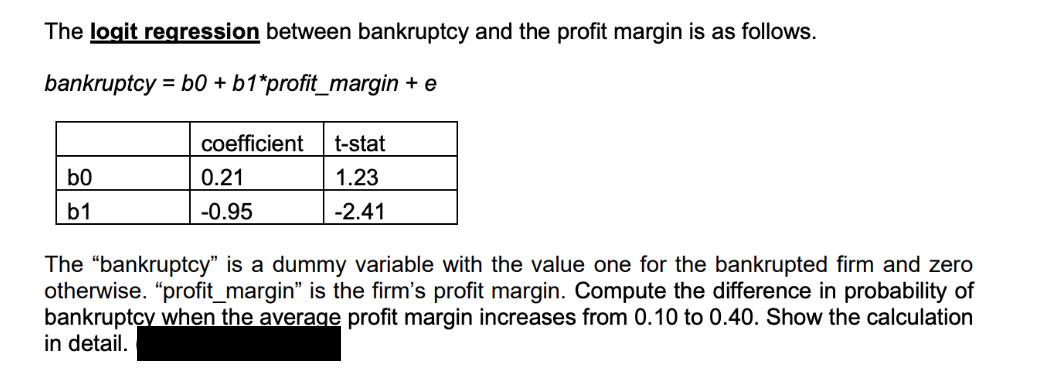
The logit regression between bankruptcy and the profit margin is as follows. bankruptcy = b0 + b1*profit_margin + e coefficient t-stat b0 0.21 1.23 b1 -0.95 -2.41 The "bankruptcy" is a dummy variable with the value one for the bankrupted firm and zero otherwise. "profit_margin" is the firm's profit margin. Compute the difference in probability of bankruptcy when the average profit margin increases from 0.10 to 0.40. Show the calculation in detail.


Q: Given the Actual Demand from January to June of 2021, along with the forecasts based on three (3)…
A: Given Information: Consider the given dataset: Month Actual Method 1 Method 2 Method 3 JAN 960…
Q: The average house has 11 paintings on its walls. Is the mean larger for houses owned by teachers?…
A: The level of significance is 0.10.
Q: USA Today reports that the average expenditure on Valentine's Day was expected to be $100.89. Do…
A:
Q: The scatterplot below shows opening weekend gross sales (measured in millions of $US) and total…
A: Given information: No. of observations=250No. of variables=2Variables=1. Weekend Gross sales…
Q: 3. (Mathematical Excursions by Aufmann). A consumer testing agency has tested the strengths of 3…
A: Given that: Company Breaking points of 1/8 inch rope in pounds Trustworthy 122, 141, 151, 114,…
Q: Scenario 1: The percentage of A's given in a physics course at a university over a long period of…
A: The provided information is α=0.01 x=40 n=300 The sample proportion is p^=xn=40300=0.133a.The null…
Q: Suppose that, for events A and B, P(A)= 0.2, P(B)= 0.85, and P(AandB)= 0.17. Are A and B…
A: Answer - Suppose that, for events A and B, P(A)= 0.2, P(B)= 0.85, and P(AandB)= 0.17.…
Q: Q8. What happens to the standard error of an estimate when the sample size in a simple random sample…
A:
Q: Identify the z-score corresponding to the indicated percentile. For the standard normal curve, find…
A:
Q: Practice Exercise 1. Let X represent the number of times a grade 10 student visits an Internet Café…
A: Since the question to be answered is not specified, we'll be answering the first question only.…
Q: The variables X and Y with zero means and standard deviations of and O₂ are normally correlated with…
A:
Q: Use the formula FV = PMT(1+i)"-1
A:
Q: 7. Based on the graph, which of the following is TRUE? A. This is a two-tailed test. B. This is a…
A: 7) The area shaded in the curve is left side.
Q: Scenario 2: The breaking strength of cables produced by a manufacturer have a mean of 1800 lb and a…
A: Given that The breaking strength of cables produced by a manufacturer have a mean of 1800 lb and a…
Q: Using the given distribution below, answer item numbers 8 - 10. Frequency Ages 15-17 2 12-14 6 9-11…
A: Mean(x¯)=∑f.x∑fMean(x¯)=15012Mean(x¯)=12.5 Class f Mid value (x) f⋅x x-x¯=|x-12.5| f⋅|x-x¯| 15…
Q: Visit your local library: On a recent Saturday, a total of 1399 people visited a local library. Of…
A: Given : Total people=1399 Under age 10yrs=249 Between age 10-18yrs=455 Between age 19-30yrs=162…
Q: What does it mean if a percentage is higher than Benford's law percentage. Can you give me a…
A: Given information: First digit Observed proportion Percent of total 1 30.10% 36.67% 2 17.60%…
Q: An advertising agency collected a random sample of 300 businesses targeted with an advertising…
A:
Q: Find k such that the function is a probability density function over the given interval. Then write…
A: Given,f(x)=kx ; 1≤x≤8
Q: Four surgical procedures currently are used to install pacemakers. If the patient does not need to…
A: Solution-: Given: α=0.05 We have following table: A B C D Clear 27 41 21 7 Return 11 15 9…
Q: ) What is the probability that a single student randomly chosen from all those taking the test…
A: here AS PER GUIDELINES I HAVE CALCULATED FIRST MAIN QUESTION The scores of students on the SAT…
Q: A sampling distribution (dotplot) for the mean quiz score for a sample n = 30 of STAT101 students is…
A:
Q: B. Consider the population consisting of values (5, 7, 9). Its population standard deviation sample…
A: The Population consisting of values 5,7,9 Population standard deviation is 1.63 with sample size 2…
Q: If A and B are independent, with P(A) = 0.5, and P (B) =0.4. Calculate the follwoing probabilities:…
A:
Q: b. Step 1. Convert the score 38 to z-score X-X Z= S = 38-45 4 Z = -1.75 Step 2. Sketch the normal…
A: To complete the activity.
Q: The college student senate is sponsoring a spring break Caribbean cruise raffle. The proceeds are to…
A: Given : Total ticket =2374 Kevin baught=34 Rate of each ticket =$5 Note :As per guidelines only…
Q: 295 is the distribution of ? N 1015 N 98.3333 is the probability that one randomly selected auto…
A: Given Data : Population Mean,μ = 1015 Population Standard Deviation,σ = 295
Q: A study was conducted that investigated the gene ACTN3, which encodes a protein that functions in…
A: A study was conducted that investigated the gene ACTN3, which encodes a protein that functions in…
Q: A study was conducted that investigated the gene ACTN3, which encodes a protein that functions in…
A: Solution: We are interested in testing the hypothesis that whether there is an association between…
Q: A study was conducted to determine whether the use of seat belts in motor vehicles depends on the…
A: Given data: Non-College Degree College Degree Total Seat Belts not worn 31 148 179 Seat…
Q: . In the following data, x is the diameter of a ponderosa pine in inches measured at breast height…
A: Use the Excel and Perform the Regression. Followings are the Steps to perform the Regression 1) Open…
Q: Ho: μ=85; Hα: μ#85. The sample mean is μ 88, the sample size is 20, and the sample standard…
A:
Q: Combined test scores were normally distributed with mean 1495 and standard deviation 348. Find the…
A: GivenMean(μ)=1495standard deviation(σ)=348
Q: Practice Exercise 1. A grade 11 student of Tabaco National High School surveyed the households in…
A:
Q: A grocery store manager did a study to look at the relationship between the amount of time (in…
A:
Q: A study was conducted that investigated the gene ACTN3, which encodes a protein that functions in…
A: Claim : there is an association between the genotype classification and the type of athlete…
Q: PROBLEM SET 8.2 1-6 ELASTIC DEFORMATIONS Given A in a deformation y= Ax, find the principal…
A: Note: As per guidelines we will solve the first question only, please repost other questions for…
Q: Scenario 1: The mean content of 25 bottles of brand S mango juice is 255 ml with a standard…
A: Given Information: Sample size n=25 Sample mean x¯=255 Sample standard deviation s=9 Claim: On…
Q: Fahrenheit) on January days in Columbus, Ohio, varies according to the Normal distribution with mean…
A: Given Data : Population Mean,μ = 19 Population Standard Deviation,σ = 10
Q: Write the null and alternative hypothesis statement of each number. The answer is already on the…
A: Stating the hypotheses assume the first step of hypothesis testing procedure.
Q: Let x be a continuous random variable with a standard normal distribution. Using the accompanying…
A: Given : z₁=1.22 z₂=1.77
Q: Verify Property 2 of the definition of a probability density function over the given interval.…
A: Given: X~Exp(α=17) f(x)=17e-17x [0,∞)
Q: A simple random sample of 36 Chowchow dog weights yields a sample mean of 193 pounds. It is known…
A: A simple random sample of 36 Chowchow dog weights; n=36 A sample mean of 193 pounds; x=193 The…
Q: The scatterplot below shows opening weekend gross sales (measured in millions of $US) and total…
A: The scatterplot is plotted between weekend gross sales (in millions of $US) and total world gross…
Q: Consider the listed actual demand in the table to the left. If the 6-week moving average forecast…
A: The question is about forecasting Given :
Q: Studies indicate that excessive noise at night can affect weight gain. One study of n = 127 rats…
A:
Q: An airline knows from experience that the distribution of the number of suitcases that get lost each…
A: GivenMean(μ)=15.5standard deviation(σ)=3.6
Q: Health insurance companies are generally faced with the problem of how much premium to charge the…
A: Solution
Q: Practice Exercise A. Samples of size n were randomly selected from the population with means and…
A: Given: A) 1. n=42, μ=25, σ2=6.25
Q: A musicologist is currently writing a report about pop songs in the late 2010s. As a part of his…
A: Given that: Sample size, n = 155 Sample mean, x¯=3.01 Population standard deviation, σ=0.3
Regression

Step by step
Solved in 2 steps with 2 images

- What does the y -intercept on the graph of a logistic equation correspond to for a population modeled by that equation?Suppose you trained your logistic regression classifier which takes an image as input and outputs either dog (class 0) or cat (class 1). Given the input image x, the hypothesis outputs 0.2. What is the probability that the input image corresponds to a dog?A multiple regression includes two regressors: Yi = b0 + b1X1i +b2X2i + ui. What is the expected change in Y if X1 increases by 8 unitsand X2 is unchanged? What is the expected change in Y if X2 decreasesby 3 units and X1 is unchanged? What is the expected change in Y if X1increases by 4 units and X2 decreases by 7 units?
- Suppose an appliance manufacturer is doing a regression analysis, using quarterly time-series data, of the factors affecting its sales of appliances. A regression equation was estimated between appliance sales (in dollars) as the dependent variable and disposable personal income and new housing starts as the independent variables. The statistical tests of the model showed large t-values for both independent variables, along with a high r2 value. However, analysis of the residuals indicated that substantial autocorrelation was present.a. What are some of the possible causes of this autocorrelation?b. How does this autocorrelation affect the conclusions concerning the significance of the individual explanatory variables and the overall explanatory power of the regression model?c. Given that a person uses the model for forecasting future appliance sales, how does this autocorrelation affect the accuracy of these forecasts?d. What techniques might be used to remove this autocorrelation…When using a regression line, the sum of the residuals should be equal to zero negative maximized positive In a sense, the standard error can be thought of as a standard deviation of the residuals. True FalseA group of scientists are interested in finding out whether the days of rainfall during the dry season could predict the magnitude of butterfly migration in the local area during wet season. Every year for twenty years, they count the total days of rainfall during the dry season preceding the migration and measure the number of butterflies migrating in the following wet season. Which type of statistical test should they use to analyze their data? (pearson's r correlation OR, simple regression equation)
- Remove the outlier and compute the least-square regression line for predicting the president's age from the first lady's age. Round the slope and y-intercept values to at least four decimal places.A 10-year study conducted by the American Heart Association provided data on how age, blood pressure, and smoking relate to the risk of strokes (Dataset "Stroke"). Risk is interpreted as the probability (times 100) that a person will have a stroke over the next 10-year period. For the smoker variable, 1 indicates a smoker and 0 indicates a nonsmoker. a. Develop an estimated regression equation that can be used to predict the risk of stroke given the age and blood-pressure level. b. Consider adding two independent variables to the model developed in part (a), one for the interaction between age and blood-pressure level and the other for whether the person is a smoker. Develop an estimated regression equation using these four independent variables. c. At a 0.05 level of significance, test to see whether the addition of the interaction term and the smoker variable contributes significantly to the estimated regression equation developed in part (a). d. Refer to the model developed in part…Compute the least-square regression line for predicting the president's age from the first lady's age. Round the slope and -intercept values to at least four decimal places.
- For the 23 space shuttle flights before the Challenger mission disaster in 1986, The following table shows the temperature (◦F) at the time of the flight and whether at least one primary O-ring suffered thermal distress. Use logistic regression to model the effect of temperature on the probability of thermal distress. Interpret the effect. Estimate the probability of thermal distress at 31◦F, the temperature at the time of the Challenger flight. At what temperature does the estimated probability equal 0.50? At that temperature, give a linear approximation for the change in the estimated probability per degree increase in temperature. Interpret the effect of temperature on the odds of thermal distress. Test the hypothesis that temperature has no effect, using (i) the Wald test, (ii) the likelihood-ratio test.Explain which characteristic of the STA leads to a consideration of a logistic model as opposed to a linear regression mode.The number of pounds of steam used per month by a chemical plant is thought to be related to the average ambient temperature (in F) for that month. The past year’s usage and temperatures are in the following table: Assuming that a simple linear regression model is appropriate, fit the regression model relating stem usage (y) to the average temperature (x). What is the estimate of Sigma2? What is the estimate of expected stem usage when the average temperature is 55 F? What change in mean stem usage is expected when the monthly average temperature changes by 1 F? Suppose that the monthly average temperature is 47 F. Calculate the fitted value of y and the corresponding residual. Test for significance of regression using α=0.01 (Use ANOVA). Calculate the r2 of the model. Find a 99% CI for B1 .