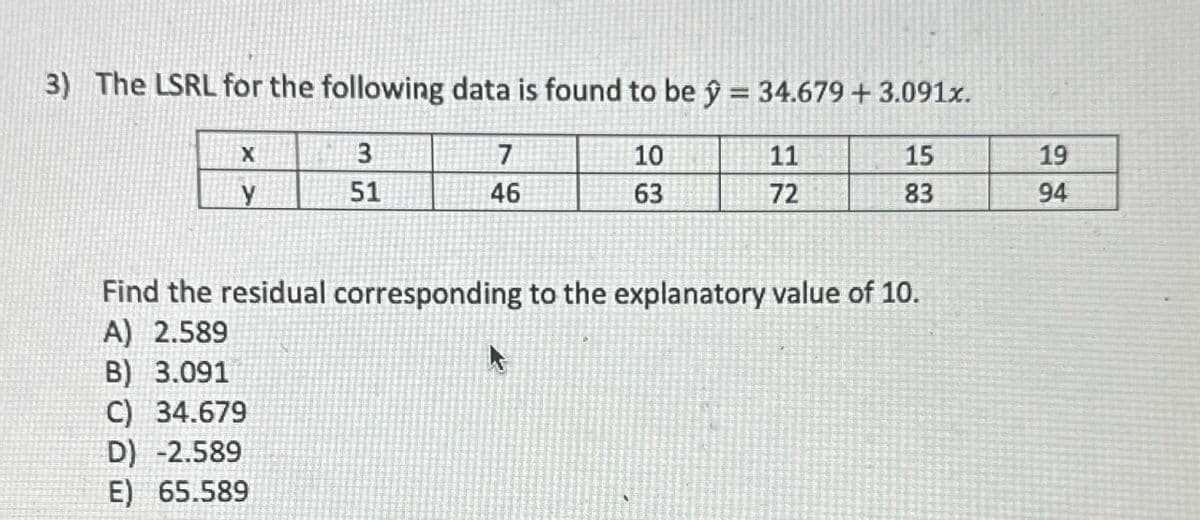
The LSRL for the following data is found to be ŷ = 34.679 + 3.091x. X 3 7 10 11 15 y 51 46 63 72 83 19 94 Find the residual corresponding to the explanatory value of 10.


Q: In a factory producing light bulbs, the quality control team randomly selects 100 bulbs from a batch…
A: The number of selected bulbs, n=100.The number of defective bulbs, x=10
Q: Which graph represents a negative linear relationship between x and y? A. B. a. B b. C CA d. None of…
A: There scatter plots are given.It is needed to find a scatterplot that depicts a negative linear…
Q: News articles that link to related stories are widely used in Web marketing. With a large number of…
A: Below is the clarified and detailed explanation for above tricky question ....if you are ok with my…
Q: Typed plz and asap please give me detailed solution and all parts if not all Also take care of…
A: The objective of this question is to predict the adjusted minimum wage in constant 2020 dollars for…
Q: Q. Table gives data on gold prices, the Consumer Price Index (CPI), and the New York Stock Exchange…
A: YearGold…
Q: Using the accompanying Cell Phone Survey data, apply ANOVA to determine if the mean response for…
A: The data on the cell phone survey is provided.The objective is to determine the null hypothesis and…
Q: of 502 randomly selected U.S. adults interviewed said they would not be bothered if the National…
A: Hypothesis testing of population proportion is used to check whether the proportion is equal to the…
Q: Question 3 a) Grace Floral Shop sells several types of roses for all occasions. It is known that 43%…
A: The objective of the question is to determine the probability distribution of the number of calls…
Q: Using multiple regression, determine the expected number of tickets sold if you spend $5800 in…
A: It is given that amount spend on podcast Ads is $5800 and the amount spend on Billboard Ads $1200.
Q: Q10.7
A: a) 369 b) n=p(1−p)(2.58/B)2option B c) sample size n = 637 Explanation: here error bound is…
Q: The city of Raleigh has 9900 registered voters. There are two candidates for city council in an…
A: The objective of this question is to find the sample statistic for the proportion of voters surveyed…
Q: A normal distribution has a mean of 140 and a standard deviation of 3. Find the z-score for a data…
A: The objective of this question is to calculate the z-score for a data value of 142 in a normal…
Q: The cross-tabulation data given below show the number of people who rated a customer service…
A: The given data is as follows:Friendliness/Politeness Staff GreetingNoYesTotalNo…
Q: You have estimated the following AR(1) model: x=0.3+0.7x+ε, What are E(x) and E(x, x) given you know…
A: The AR(1) model is given as follows:.
Q: i need the answer quickly
A: To address this task, let's follow it in structured parts for clarity and understanding.1. Three-Day…
Q: Solve this for me
A: The objective of this question is to find the probability that at least 6 out of 7 randomly selected…
Q: 3.4.7 Consider the Markov chain whose transition probability matrix is given by 0 1 2 3 0|| 1 0 0 0…
A: Given the Markov chain with transition probability matrix:
Q: A manufacturer knows that their items have a normally distributed length, with a mean of 13.8…
A:
Q: American households increasingly rely on cell phones as their exclusive telephone service. It is…
A: The question is about discrete probability distribution.Given :Proportion of households have…
Q: You fit a two parameter pareto distribution to a sample of 100 claims amounts x1, x2, ..., X100 and…
A: random variables follow the Pareto distribution with parameter () The sample size, claims andThe…
Q: If X and Y are independent and identically distributed exponential variables with parameter λ = 5 '…
A: We have given:X & Y = independent and identically distributed exponential variablesWe have to…
Q: What is the difference between the independent variable and the dependent variable?
A: We have to explain the difference between independent and dependent variable.
Q: The heights of 1500 students are normally distributed with a mean of 176.5 centimeters and a…
A: No. of students, The students' heights have a normal distribution.Mean height, cmsStandard…
Q: In the country of United States of Heightlandia, the height measurements of ten-year-old children…
A: The objective of this question is to find the probability of a randomly chosen child having a height…
Q: In 2011, a U.S. Census report determined that 71% of college students work. A researcher thinks this…
A: a)The hypothesized proportion is 0.71.
Q: The Acme Company manufactures widgets. The distribution of widget weights is bell-shaped with a mean…
A: a.Suppose the random variable x defines the weight of a randomly selected widget.According to the…
Q: A concerned group of citizens wanted to know if the proportion of armed robberies in Texas was…
A: a) H0: p2010=p2011H1: p2010≠p2011 b) z=-3.33c) p = 0.0009d) Reject the null hypothesise) There is…
Q: Joint distributions for X, Y, and Z: Y=0 Y=1 Y=0 Y=1 X=0 0.125 0.125 0.405 0.045 X=1 0.125 0.125…
A: Joint distribution for X, Y, and Z is provided. The question's purpose is to calculate the…
Q: X 5, USA Today reported that approximately 25% of all state prison inmates released on parole become…
A: 5) Let x = number of prisoners out of five on parole who become repeat offenders.The probability…
Q: i need the answer quickly
A: The data values…
Q: In the following table, price of a used car is given in terms of the percentage of the car's…
A: The objective of this question is to find the best linear fit to the given data that minimizes the…
Q: Given the distribution below, what is EX? x P(X=x) -23 0.22 3 0.54 11 0.01 43 0.11…
A: The objective of the question is to calculate the expected value (EX) of a random variable X. The…
Q: What is the probability that the height of a randomly chosen child is between 52.95 and 54.55…
A: Mean:μ=54.5Standard deviation:σ=1.3
Q: 5. Two 99 percent confidence intervals will be constructed to estimate the difference in means of…
A: The objective of the question is to understand the relationship between the widths of two confidence…
Q: Let X be the weights of newborn babies in pounds, and denote m to be its median. For a sample of 14,…
A: π0.25=6.7π0.35=8.1m=9.5π0.75=11.45 Explanation: Sample Quantile: The πp quantile of a data set…
Q: Analysing passenger car sales by brands in Australia Tupps Motors which was established in year…
A: Part C:(a) To display the market share of the top 10 brands of passenger vehicles in 2018, a pie…
Q: In a baseball playoff series, the two teams are evenly matched. The two teams must play until one…
A: baseball teams are evenly matched in the playoff series.The play continues until team wins games…
Q: Explain why two samples from the same population could differ. Why do we say that two samples test…
A: The objective of the question is to understand why two samples from the same population could differ…
Q: Test the claim below about the mean of the differences for a population of paired data at the level…
A: Given,Claim: Level of significance, α = 0.05Sample statistics:n = 12
Q: 3.4.12 A Markov chain Xo. X1, X2,... has the transition probability matrix 0 1 2 0 0.3 0.2 0.5 P 1…
A: The transition probability matrix of the Markov chain:The process begins at the state and ends at…
Q: A survey found that women's heights are normally distributed with mean 63.7 in and standard…
A: a) The percentage of women who meet the height requirement = 99.34 % (round 2…
Q: 不 A simple random sample of size n=67 is obtained from a population that is skewed left with u 41…
A: Here the given information is : A simple random sample of size n=67 , is obtained from a population…
Q: We assume that the height of Hong Kong people obeys Gaussian distribution with m and m. In door…
A: The problem statement represents "m" as the height distribution, which is Gaussian with mean (m) and…
Q: Q10.2
A: a . To find the point estimate of the true mean salt content (\( \mu \)) for frankfurters, you need…
Q: For the cross-labulation data shown below, which represents a count of the type of books that…
A: The cross-tabulation data which represents the type of books that an individual prefers is shown…
Q: A data center contains 1000 computer servers. Each server has probability 0.004 of failing on a…
A: From the provided information,n = 1000Probability of failing server on a given day (p) = 0.004
Q: A scientist claims that pneumonia causes weight loss in mice. The table shows the weights (in grams)…
A: Given the sample data are the weights(in grams) of six mice before infection and two days after…
Q: s=√13.33 =3.65
A: Range:Range is the difference between the maximum and minimum values in the data set. In this…
Q: The following table shows rooms offered by Hotel ABC. Twin Single Twin Executive Superior With 15 10…
A: The number of customers who will book an executive room with a bathtub is 6.The number of rooms that…
Q: What does this plot show about the model being analysed?
A: The residual plot shows the predicted or the fitted values on the x-axis and the residuals (the…

Step by step
Solved in 3 steps with 5 images

- Given that n=82 data points are collected when studying the relationship between average daily temperature and time spent watching television, use the critical values table below to determine if a calculated value of r=−0.974 is significant or not. df CV (+ and -) df CV (+ and -) df CV (+ and -) df CV (+ and -) 1 0.997 11 0.555 21 0.413 40 0.304 2 0.950 12 0.532 22 0.404 50 0.273 3 0.878 13 0.514 23 0.396 60 0.250 4 0.811 14 0.497 24 0.388 70 0.232 5 0.754 15 0.482 25 0.381 80 0.217 6 0.707 16 0.468 26 0.374 90 0.205 7 0.666 17 0.456 27 0.367 100 0.195 8 0.632 18 0.444 28 0.361 9 0.602 19 0.433 29 0.355 10 0.576 20 0.423 30 0.349 Select the correct answer below: r is significant because it is between the positive and negative critical values. r is not significant because it is between the positive and negative critical values. r is significant because it is not between the positive and negative critical values. r is not…A. Determine the coefficient of determination and alienation – interpret B. Is r statistically significant at .05? (rxy= 0.2559) Participant Hours slept Anxiety Level 1 6 4 2 6 3 3 6 3 4 4 3 5 5 3 6 4 2 7 5 3 8 4 2 9 5 3 10 6 4 11 4 5 Mean 5.00 3.18 SD 0.89 0.87You obtained the following raw data when setting up a Biuret standard curve: BSA (mg/ml) Absorbancy 540nm 0 0.158 1 0.210 2 0.260 3 0.305 4 0.360 5 0.410 6 0.455 7 0.510 8 0.530 9 0.550 10 0.554 What would the quality of the line-fit (R2 value) be if you do not exclude experimental outliers? (Give you answer to 4 decimal places)
- The following data pertain to x, the amount of fertil-izer (in pounds) that a farmer applies to his soil, and y, his yield of wheat (in bushels per acre): xy xy xy112 33 88 24 37 2792 28 44 17 23 972 38 132 36 77 3266 17 23 14 142 38112 35 57 25 37 1388 31 111 40 127 2342 8 69 29 88 31126 37 19 12 48 3772 32 103 27 61 2552 20 141 40 71 1428 17 77 26 113 26 Assuming that the data can be looked upon as a randomsample from a bivariate normal population, calculate rand test its significance at the 0.01 level of significance.Also, draw a scattergram of these paired data and judgewhether the assumption seems reasonable.Here is a bivariate data set.xy182425915011737106295223812246 Find the correlation coefficient and report it accurate to four decimal places. r =. A study is conducted on the relationship of the number of absences (x) and the grades (y) of 15 students in BC212. Using r at 0.05 level of significance and the hypothesis that there is no significant relationship between absences and grades of the students in BC212, determine the relationship using the following data.r.05 = - 0.514Number of Absencesx Grades in BC212y122338614551219 908580758065709580807592898065
- In studying the relationship between age and time spent exercising, suppose you computed r=−0.307 using n=20 data points. Using the critical values table below, determine if the value of r is significant or not. df CV (+ and -) df CV (+ and -) df CV (+ and -) df CV (+ and -) 1 0.997 11 0.555 21 0.413 40 0.304 2 0.950 12 0.532 22 0.404 50 0.273 3 0.878 13 0.514 23 0.396 60 0.250 4 0.811 14 0.497 24 0.388 70 0.232 5 0.754 15 0.482 25 0.381 80 0.217 6 0.707 16 0.468 26 0.374 90 0.205 7 0.666 17 0.456 27 0.367 100 0.195 8 0.632 18 0.444 28 0.361 9 0.602 19 0.433 29 0.355 10 0.576 20 0.423 30 0.349 Select the correct answer below: 1) r is significant because it is between the positive and negative critical values. 2) r is not significant because it is between the positive and negative critical values. 3) r is significant because it is not between the positive and negative critical values. 4) r is not significant because it is…A sample of average high temperature during July (x) of cities in Colorado compared to their elevation in feet (y) yields the following results: x 90 75 85 94 89 94 78 76 88 y 5280 9494 6035 4078 6191 4583 8000 8022 5807 Find x^2Let X1,...,Xn be an iid sample from f(x | θ) = θ xθ−1, 0 < x < 1, where the parameter θ is positive. Find the MLE and MOM estimators for θ
- Let X1, . . . , Xn be an iid sample from f(x | θ) = θxθ−1 , 0 < x < 1, where the parameter θ is positive. Find the MLE and MOM estimators for θ.Let X1,...,Xn be an iid sample from f(x | θ) = θxθ−1, 0 < x < 1, where the parameter θ is positive. Find the MLE and MOM estimators for θSuppose a linear model y=β0+β1xy=β0+β1x is fit to a sample data set, and a test of the null hypothesis H0:β1=0H0:β1=0 against an alternative hypothesis HA:β1≠0HA:β1≠0 is performed; a PP-value of 0.4203 is obtained. Which of the following scatter plots depicts the data set on which this model was fit and the hypothesis test was performed?