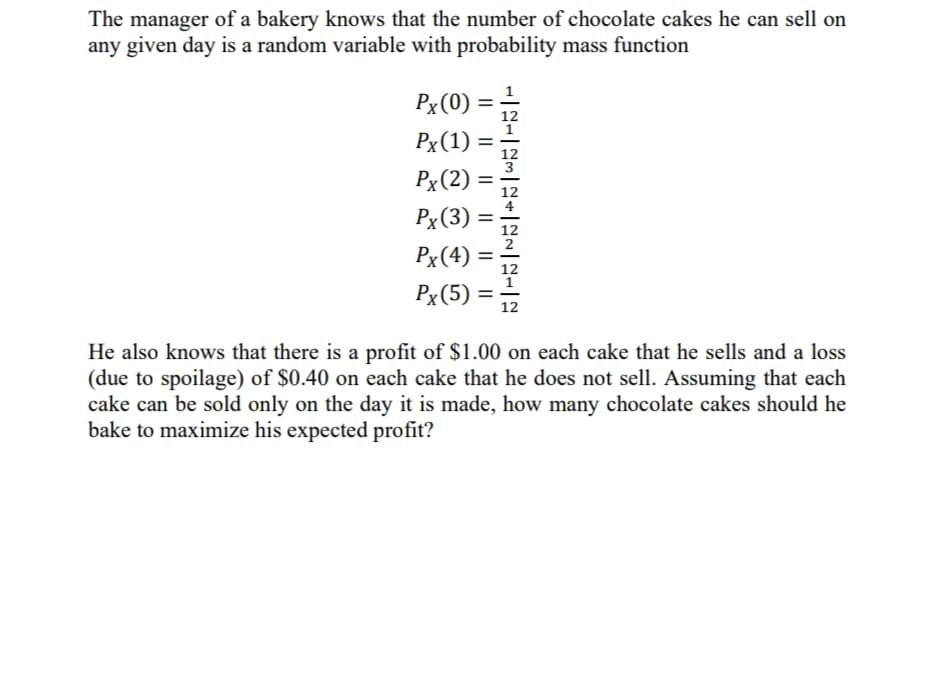
The manager of a bakery knows that the number of chocolate cakes he can sell on any given day is a random variable with probability mass function Px(0) 12 Px(1) = Px(2) %3D Px(3) %3D Px(4) = 12 %3D Px(5) = 2 He also knows that there is a profit of $1.00 on each cake that he sells and a loss (due to spoilage) of $0.40 on each cake that he does not sell. Assuming that each cake can be sold only on the day it is made, how many chocolate cakes should he bake to maximize his expected profit? II


Q: A company produces and sells luxury goods and is able to control the demand for the product by…
A: A company produces and sells luxury goods and can control the demand for the product by varying the…
Q: SureStep is currently getting 160 regular-time hours from each worker per month. This is actually…
A: Productivity and complete output standards are met in an organization where the workers work with…
Q: Well-known financial writer Andrew Tobias argues that he can earn 177 percent per year buying wine…
A: The cost of a case of wine is 10 percent less than the cost of 12 individual bottles, so the cost of…
Q: CA Corporate has an available funds of $200,000 is considering for new investment opportunities. The…
A: Investment portfolio of stocks is given as follows:
Q: W. L. Brown, a direct marketer of women’s clothing,must determine how many telephone operators…
A: The aforementioned question is answered as below:
Q: The management of the Keribels Company wishes to apply the Miller-Orr model to manage its cash…
A: Given data, Transaction cost =$100 Cash flow variance=75000 I =0.05%
Q: A computer reseller needs to decide how many laptops to order next month. The lowest end laptop…
A: From the above mentioned information the demand probabilities for, P (0) = 0.3, P (1) = 0.4, P(2)…
Q: The aim of the objective function for Chris Beehner Company should be to the objective value.…
A: Linear programming is a mathematical technique that is also used in operations management…
Q: he probability that a mobile phone is stolen in an electronic shop is 0.0008. If 8500 mobile phones…
A: Quality refers to the degree of excellence of something. Quality has some standard on the basis of…
Q: A hardware company sells a lot of low-cost, highvolumeproducts. For one such product, it is…
A: given, low sales = 60,000 high sales = 100,000 variable cost per unit 25% chance of = $6…
Q: strategy that maximizes the department store chain's expected profit earned by purchasing and…
A: πij= Revenue from regular price +Revenue from closeoutprice-cost of purchase =…
Q: Suppose you are a financial analyst and your company runs many simulation models to estimate the…
A: Simulation modeling: A simulation model is a computerized model that would depict or imitate a…
Q: A computer reseller needs to decide how many laptops to order next month. The lowest end laptop…
A: Hi There, thanks for posting the question. But as per Q&A authoring guidelines, we must answer…
Q: The management of Brinkley Corporation is interested in using simulation to estimate the profit per…
A: Given data: Procurement Cost ($) Probability Labor cost Probability Transportation Cost…
Q: We must invest all our money in two stocks: x and y.The variance of the annual return on one share…
A:
Q: A buyer for a large department store chain must place orders with an athletic shoe manufacturer six…
A: Given, Cost Price = $65 Selling Price = $85 Closeout sell price = $55 Demand (100s of pairs)…
Q: A building contains 1000 lightbulbs. Each bulb lastsat most five months. The company maintaining…
A: In the above question, the company wants to decide whether the group replacement policy is…
Q: Toby’s Trucking Company determined that the distance travelled per truck per year is normally…
A: Proportion is the amount or figure which is in between and mixes of the variables. Here in this…
Q: On a decision tree, once the tree has been drawn and the payoffs and probabilities have been placed…
A: Decision-making is a process of choosing the best options among the alternatives available. It has a…
Q: andrew thomas , a sandwich vendor at hard rock cafe 's annual rockfest, created a table of…
A: given possibility of big demand =0.3 possibility of Average demand =0.5 possibility of small demand…
Q: Select the least accurate statement regarding simulation. In a simulation, correlation between two…
A: In insights, connection or reliance is any factual relationship, if causal, between two arbitrary…
Q: A particular automobile costs an average of $21,755 in the Pacific Northwest. The standard deviation…
A: A random sample is a sample of the population where the variables in the samples are taken randomly.…
Q: A metropolitan school system consists of three districts—north, south, and central. The north…
A: A metropolitan school has different district where students studies, They have given details of…
Q: Compcomm, Inc., is an international communications andinformation technology company that has seen…
A: The simulation model is following
Q: A forest consists of two types of trees: those that are 0–5 ft and those that are taller than 5 ft.…
A: Step 1: As each year 40% of all 0-5ft trees die and other 10% are sold. That means the probability…
Q: An investment advisor at Shore Financial Services wants to develop a model that can be used to…
A: Since we only answer up to 3 sub-parts, we’ll answer the first 3. Please resubmit the question and…
Q: Two companies are producing widgets. It costs the first company q12 dollars to produce q1 widgets…
A: Given: First company Second company q12 dollars 0.5q22 dollars
Q: 2. A daily demand for loaves of bread at a grocery store is given by the fllowing probability…
A: Given data is
Q: Appliances Unlimited (AU) sells refrigerators. Anyrefrigerator that fails before it is three years…
A: Warranty refers to a facility that is provided to consumers in case of any malfunctioning product…
Q: The unit price is 50$. The company produces 50000 units per month. The unit cost follows a…
A: THE ANSWER IS AS BELOW:
Q: The members of a private golf club have handicaps that are normally distributedwith mean 15 and…
A: Hence, the standard deviation of sample mean is 1.75.
Q: The alternatives shown are to be compared on the basis of their present worth values. At an interest…
A: Given- Particular Alternative B Alternative B First Year -10000 -25000 M/O Cost/year…
Q: • Formulate the problem of deciding how much of each product to make in the current week as a linear…
A: The linear programming method is a mathematical method by which the best outcome where profits are…
Q: Suppose that Pizza King and Noble Greek stopadvertising but must determine the price they will…
A: Let us first find all the possible actions available to Pizza King in this case: 1) Pizza King sell…
Q: Dataware is trying to determine whether to give a $10 rebate, cut the price $6, or have no price…
A: Consider creating a $10 rebate for a $45 product. Alternatives to a rebate would be to reduce the…
Q: The management of the Keribels Company wishes to apply the Miller-Orr model to manage its cash…
A: Given data, Transaction cost =$100 Cash flow variance=75000 I =0.05%
Q: The management of Brinkley Corporation is interested in using simulation to estimate the profit per…
A: Here the unit formula is given by --> Unit profit =Unit revenue - (Procurement +Lbour +…
Q: You have prepared a coin flipping simulation. In your simulation, a value of less than 0.5 is…
A: Below is the solution:-
Q: A producer is currently selling three different brands (Brand A, Brand B, and Brand C) of fountain…
A: The given data is shown in a tabular form. Per unit data Brand A Brand B Brand C…
Q: A product manager at Clean & Brite (C&B) wants to determine whether her company should market a new…
A: Think about the case of Clean and Brite (C and B) choosing to dispatch new brand…
Q: If An investor is considering investing in two securities A and B which promise a return of (10+X)%…
A: SOLUTION:
Q: A salesperson for Fuller Brush has three options: quit,put forth a low-effort level, or put forth a…
A:
Q: The daily demand for a product in a shop can assume one of the following values: 100, 120, or 130…
A: The optimal stock assigns the specific measure of stock a business needs to satisfy routine interest…
Q: A group of 5 players play the following game. Each writes down a positive integer that is less than…
A: ANSWER:


Trending now
This is a popular solution!

Step by step
Solved in 3 steps with 3 images


- Suppose you begin year 1 with 5000. At the beginning of each year, you put half of your money under a mattress and invest the other half in Whitewater stock. During each year, there is a 40% chance that the Whitewater stock will double, and there is a 60% chance that you will lose half of your investment. To illustrate, if the stock doubles during the first year, you will have 3750 under the mattress and 3750 invested in Whitewater during year 2. You want to estimate your annual return over a 30-year period. If you end with F dollars, your annual return is (F/5000)1/30 1. For example, if you end with 100,000, your annual return is 201/30 1 = 0.105, or 10.5%. Run 1000 replications of an appropriate simulation. Based on the results, you can be 95% certain that your annual return will be between which two values?In Problem 11 from the previous section, we stated that the damage amount is normally distributed. Suppose instead that the damage amount is triangularly distributed with parameters 500, 1500, and 7000. That is, the damage in an accident can be as low as 500 or as high as 7000, the most likely value is 1500, and there is definite skewness to the right. (It turns out, as you can verify in @RISK, that the mean of this distribution is 3000, the same as in Problem 11.) Use @RISK to simulate the amount you pay for damage. Run 5000 iterations. Then answer the following questions. In each case, explain how the indicated event would occur. a. What is the probability that you pay a positive amount but less than 750? b. What is the probability that you pay more than 600? c. What is the probability that you pay exactly 1000 (the deductible)?It is surprising (but true) that if 23 people are in the same room, there is about a 50% chance that at least two people will have the same birthday. Suppose you want to estimate the probability that if 30 people are in the same room, at least two of them will have the same birthday. You can proceed as follows. a. Generate random birthdays for 30 different people. Ignoring the possibility of a leap year, each person has a 1/365 chance of having a given birthday (label the days of the year 1 to 365). You can use the RANDBETWEEN function to generate birthdays. b. Once you have generated 30 peoples birthdays, how can you tell whether at least two people have the same birthday? One way is to use Excels RANK function. (You can learn how to use this function in Excels online help.) This function returns the rank of a number relative to a given group of numbers. In the case of a tie, two numbers are given the same rank. For example, if the set of numbers is 4, 3, 2, 5, the RANK function returns 2, 3, 4, 1. (By default, RANK gives 1 to the largest number.) If the set of numbers is 4, 3, 2, 4, the RANK function returns 1, 3, 4, 1. c. After using the RANK function, you should be able to determine whether at least two of the 30 people have the same birthday. What is the (estimated) probability that this occurs?
- In August of the current year, a car dealer is trying to determine how many cars of the next model year to order. Each car ordered in August costs 20,000. The demand for the dealers next year models has the probability distribution shown in the file P10_12.xlsx. Each car sells for 25,000. If demand for next years cars exceeds the number of cars ordered in August, the dealer must reorder at a cost of 22,000 per car. Excess cars can be disposed of at 17,000 per car. Use simulation to determine how many cars to order in August. For your optimal order quantity, find a 95% confidence interval for the expected profit.A European put option allows an investor to sell a share of stock at the exercise price on the exercise data. For example, if the exercise price is 48, and the stock price is 45 on the exercise date, the investor can sell the stock for 48 and then immediately buy it back (that is, cover his position) for 45, making 3 profit. But if the stock price on the exercise date is greater than the exercise price, the option is worthless at that date. So for a put, the investor is hoping that the price of the stock decreases. Using the same parameters as in Example 11.7, find a fair price for a European put option. (Note: As discussed in the text, an actual put option is usually for 100 shares.)An automobile manufacturer is considering whether to introduce a new model called the Racer. The profitability of the Racer depends on the following factors: The fixed cost of developing the Racer is triangularly distributed with parameters 3, 4, and 5, all in billions. Year 1 sales are normally distributed with mean 200,000 and standard deviation 50,000. Year 2 sales are normally distributed with mean equal to actual year 1 sales and standard deviation 50,000. Year 3 sales are normally distributed with mean equal to actual year 2 sales and standard deviation 50,000. The selling price in year 1 is 25,000. The year 2 selling price will be 1.05[year 1 price + 50 (% diff1)] where % diff1 is the number of percentage points by which actual year 1 sales differ from expected year 1 sales. The 1.05 factor accounts for inflation. For example, if the year 1 sales figure is 180,000, which is 10 percentage points below the expected year 1 sales, then the year 2 price will be 1.05[25,000 + 50( 10)] = 25,725. Similarly, the year 3 price will be 1.05[year 2 price + 50(% diff2)] where % diff2 is the percentage by which actual year 2 sales differ from expected year 2 sales. The variable cost in year 1 is triangularly distributed with parameters 10,000, 12,000, and 15,000, and it is assumed to increase by 5% each year. Your goal is to estimate the NPV of the new car during its first three years. Assume that the company is able to produce exactly as many cars as it can sell. Also, assume that cash flows are discounted at 10%. Simulate 1000 trials to estimate the mean and standard deviation of the NPV for the first three years of sales. Also, determine an interval such that you are 95% certain that the NPV of the Racer during its first three years of operation will be within this interval.
- Although the normal distribution is a reasonable input distribution in many situations, it does have two potential drawbacks: (1) it allows negative values, even though they may be extremely improbable, and (2) it is a symmetric distribution. Many situations are modelled better with a distribution that allows only positive values and is skewed to the right. Two of these that have been used in many real applications are the gamma and lognormal distributions. @RISK enables you to generate observations from each of these distributions. The @RISK function for the gamma distribution is RISKGAMMA, and it takes two arguments, as in =RISKGAMMA(3,10). The first argument, which must be positive, determines the shape. The smaller it is, the more skewed the distribution is to the right; the larger it is, the more symmetric the distribution is. The second argument determines the scale, in the sense that the product of it and the first argument equals the mean of the distribution. (The mean in this example is 30.) Also, the product of the second argument and the square root of the first argument is the standard deviation of the distribution. (In this example, it is 3(10=17.32.) The @RISK function for the lognormal distribution is RISKLOGNORM. It has two arguments, as in =RISKLOGNORM(40,10). These arguments are the mean and standard deviation of the distribution. Rework Example 10.2 for the following demand distributions. Do the simulated outputs have any different qualitative properties with these skewed distributions than with the triangular distribution used in the example? a. Gamma distribution with parameters 2 and 85 b. Gamma distribution with parameters 5 and 35 c. Lognormal distribution with mean 170 and standard deviation 60The annual demand for Prizdol, a prescription drug manufactured and marketed by the NuFeel Company, is normally distributed with mean 50,000 and standard deviation 12,000. Assume that demand during each of the next 10 years is an independent random number from this distribution. NuFeel needs to determine how large a Prizdol plant to build to maximize its expected profit over the next 10 years. If the company builds a plant that can produce x units of Prizdol per year, it will cost 16 for each of these x units. NuFeel will produce only the amount demanded each year, and each unit of Prizdol produced will sell for 3.70. Each unit of Prizdol produced incurs a variable production cost of 0.20. It costs 0.40 per year to operate a unit of capacity. a. Among the capacity levels of 30,000, 35,000, 40,000, 45,000, 50,000, 55,000, and 60,000 units per year, which level maximizes expected profit? Use simulation to answer this question. b. Using the capacity from your answer to part a, NuFeel can be 95% certain that actual profit for the 10-year period will be between what two values?If you want to replicate the results of a simulation model with Excel functions only, not @RISK, you can build a data table and let the column input cell be any blank cell. Explain why this works.
- Suppose that GLC earns a 2000 profit each time a person buys a car. We want to determine how the expected profit earned from a customer depends on the quality of GLCs cars. We assume a typical customer will purchase 10 cars during her lifetime. She will purchase a car now (year 1) and then purchase a car every five yearsduring year 6, year 11, and so on. For simplicity, we assume that Hundo is GLCs only competitor. We also assume that if the consumer is satisfied with the car she purchases, she will buy her next car from the same company, but if she is not satisfied, she will buy her next car from the other company. Hundo produces cars that satisfy 80% of its customers. Currently, GLC produces cars that also satisfy 80% of its customers. Consider a customer whose first car is a GLC car. If profits are discounted at 10% annually, use simulation to estimate the value of this customer to GLC. Also estimate the value of a customer to GLC if it can raise its customer satisfaction rating to 85%, to 90%, or to 95%. You can interpret the satisfaction value as the probability that a customer will not switch companies.Based on Babich (1992). Suppose that each week each of 300 families buys a gallon of orange juice from company A, B, or C. Let pA denote the probability that a gallon produced by company A is of unsatisfactory quality, and define pB and pC similarly for companies B and C. If the last gallon of juice purchased by a family is satisfactory, the next week they will purchase a gallon of juice from the same company. If the last gallon of juice purchased by a family is not satisfactory, the family will purchase a gallon from a competitor. Consider a week in which A families have purchased juice A, B families have purchased juice B, and C families have purchased juice C. Assume that families that switch brands during a period are allocated to the remaining brands in a manner that is proportional to the current market shares of the other brands. For example, if a customer switches from brand A, there is probability B/(B + C) that he will switch to brand B and probability C/(B + C) that he will switch to brand C. Suppose that the market is currently divided equally: 10,000 families for each of the three brands. a. After a year, what will the market share for each firm be? Assume pA = 0.10, pB = 0.15, and pC = 0.20. (Hint: You will need to use the RISKBINOMLAL function to see how many people switch from A and then use the RISKBENOMIAL function again to see how many switch from A to B and from A to C. However, if your model requires more RISKBINOMIAL functions than the number allowed in the academic version of @RISK, remember that you can instead use the BENOM.INV (or the old CRITBENOM) function to generate binomially distributed random numbers. This takes the form =BINOM.INV (ntrials, psuccess, RAND()).) b. Suppose a 1% increase in market share is worth 10,000 per week to company A. Company A believes that for a cost of 1 million per year it can cut the percentage of unsatisfactory juice cartons in half. Is this worthwhile? (Use the same values of pA, pB, and pC as in part a.)Suppose you currently have a portfolio of three stocks, A, B, and C. You own 500 shares of A, 300 of B, and 1000 of C. The current share prices are 42.76, 81.33, and, 58.22, respectively. You plan to hold this portfolio for at least a year. During the coming year, economists have predicted that the national economy will be awful, stable, or great with probabilities 0.2, 0.5, and 0.3. Given the state of the economy, the returns (one-year percentage changes) of the three stocks are independent and normally distributed. However, the means and standard deviations of these returns depend on the state of the economy, as indicated in the file P11_23.xlsx. a. Use @RISK to simulate the value of the portfolio and the portfolio return in the next year. How likely is it that you will have a negative return? How likely is it that you will have a return of at least 25%? b. Suppose you had a crystal ball where you could predict the state of the economy with certainty. The stock returns would still be uncertain, but you would know whether your means and standard deviations come from row 6, 7, or 8 of the P11_23.xlsx file. If you learn, with certainty, that the economy is going to be great in the next year, run the appropriate simulation to answer the same questions as in part a. Repeat this if you learn that the economy is going to be awful. How do these results compare with those in part a?