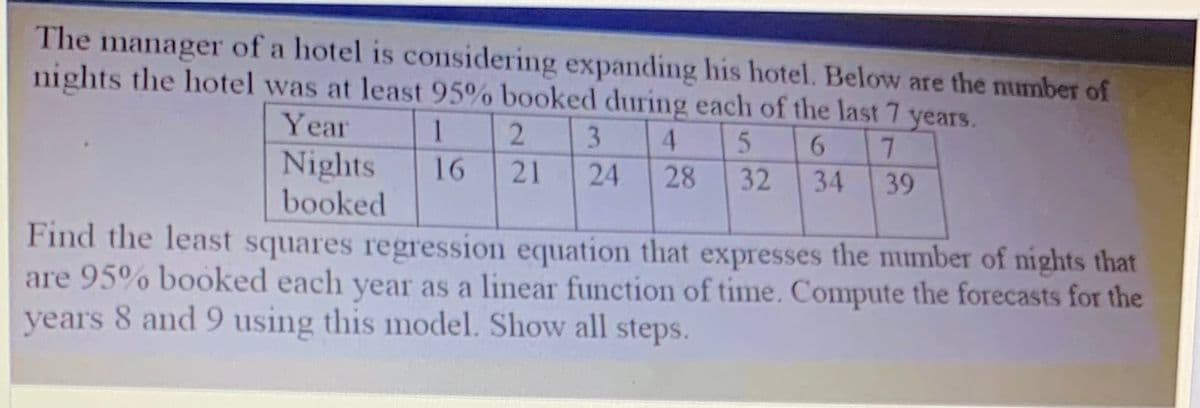
The manager of a hotel is considering expanding his hotel. Below are the mumber of nights the hotel was at least 95% booked during each of the last 7 years. Year Nights booked 1 2 3 21 16 24 28 32 34 39 Find the least squares regression equation that expresses the number of nights that are 95% booked each year as a linear function of time. Compute the forecasts for the years 8 and 9 using this model. Show all steps.


Q: The table below shows the weights z to the nearest pound, heights x to the nearest inch, and ages y…
A: Step-by-step procedure to find the regression line using Excel: In Excel sheet, enter z, x and y in…
Q: The sales of a company (in million dollors) for each year are shown in the table below. X (Year) |…
A: a) the least square regression line is obtained below: The required value will provide by the…
Q: The following table shows the length, In centimeters, of the humerus and the total wingspan, In…
A: The regression equation isy^=20.32x+21.05 b)If x=52, theny=20.3252+21.05=1077.69
Q: Suppose Wesley is a marine biologist who is interested in the relationship between the age and the…
A:
Q: The average number of people in a family attending college for various years is given in the table…
A:
Q: The data regarding the production of wheat in tons (X) and the price of the kilo of our in Ghana…
A: Solution: 3. Let X be the production of wheat in tons and Y be the price of the kilo of flour in…
Q: Suppose Wesley is a marine biologist who is interested in the relationship between the age and the…
A: The provided equation of regression line is:
Q: Compute the least-squares regression equation for the given data set. Use a TI-84 calculator. Round…
A: The independent variable is x. The dependent variable is y. This is simple linear regression model.…
Q: A financial analyst is examining the relationship between stock prices and earnings per share. She…
A:
Q: The following table gives the experience (in years) and the number of computers sold during the…
A: Linear regression: Suppose (x1, y1), (x2, y2)---(xn, yn) are n pairs of observations on variables X…
Q: The following table lists the birth weights (in pounds), x, and the lengths (in inches), y, for a…
A: Calculate Fitting a straight line - Curve fitting using Least square method X Y 6 17 10 20…
Q: Suppose we take a sample of seven households from a low-to-middle-income neighbourhood and collect…
A: we have given the data in x and y form then least square regression line is: y = mx + c here m = N…
Q: A security firm wants to renew the uniforms used by his personnel. It starts by collecting data on…
A: Step-by-step procedure to find the regression equation using Excel: In Excel sheet, enter Height in…
Q: Suppose Wesley is a marine biologist who is interested in the relationship between the age and the…
A: Wesley collects data on 1,000 crabs and uses the data to develop the least-squares regression line…
Q: The table contains data on vehicle speed (h) and fuel consumption (lt / 100km) of 5 randomly…
A:
Q: Suppose Wesley is a marine biologist who is interested in the relationship between the age and the…
A:
Q: The following table lists the birth weights (in pounds), x, and the lengths (in inches), y, for a…
A: We have given that x and y data And we want to find Regression equation .
Q: Which equation of the least squares regression line most closely matches the data set? х у 30 6. 38…
A: The x and y values given is as follows
Q: Find the y-intercept of the equation of the least-squares regression line for the dataset in the tat…
A: Step-by-step procedure to find the regression equation using Excel: In Excel sheet, enter X in one…
Q: The following data represents the rate of return of the stock exchange (x) and the rate of return of…
A: Solution: As per the guidelines only first three sub parts should be answered. If the remaining…
Q: Find the slope m for the least-squares regression line. x y 7 15 10 16 15 25 18 32
A:
Q: A scatterplot comparing the variables a and v is shown below. 30 28 26 24 22 20+ I8 16 14 12 10 <+…
A:
Q: The table below is a record of the number of miles driven between stops for gas and the amount of…
A: Given data, X Y X*Y X*X 290 23.63 6852.7 84100 283 23.06 6525.98 80089 288 23.29 6707.52…
Q: The dean of the Business School at a small Florida college wishes to determine whether the…
A: A) In this case, the GPA is the independent variable (x), and the starting salary is the dependent…
Q: The following table gives the experience (in years) and the number of computers sold during the…
A: The simple line of regression for Y on X is, Y=a+bXwhere a=intercept of the regression line…
Q: The owner of a bicycle store wonders if the employees who take the longest lunch breaks also make…
A: The line of regression is used to predict the data values The slope of the regression line is the…
Q: Find the least squares regression equation for the data in the table below: x 14 37 43 25 25 25 15…
A: From given data, X Y X*Y Y*Y 14 44 616 196 37 49 1813 1369 43 52 2236 1849 25 44 1100 625…
Q: An experiment is run. The mass of an object is recorded over time. Time (min) Mass (g) 11 35 12 11…
A: Given data, X Y X*Y X*X 11 35 385 121 12 11 132 144 13 7 91 169 16 7 112 256 41 7 287…
Q: A least squares regression line was calculated to relate the length (cm) of newbom boys to their…
A: Given that length (cm) of a newborn boy is related to their weight in kg. The least-square…
Q: In a statistics course, a linear regression equation was computed to predict the final exam score…
A:
Q: The operations manager of a musical instrument distributor feels that demand for a particular type…
A: By using linear regression, a) sample mean (x̄) = Σx/n = 330/6 = 55 sample mean (ȳ) = Σy/n =…
Q: Q5/ Use Linear Regression to fit the following data: 2 10 1 4 5 6 Y 4 10 9 3
A:
Q: sixth-grade teacher believes that there is a relationship between his students’ IQ scores (y) and…
A:
Q: Find the equation of the least squares regression line of y on x, for the following sets of data:…
A:
Q: (d) Find the least-squares regression line treating the rate of return of Company 1 as the…
A: In order to obtain the regression equation, first perform regression analysis on the data.
Q: Suppose Wesley is a marine biologist who is interested in the relationship between the age and the…
A:
Q: Compute the least-squares regression equation for the given data set. Use a TI-84 calculator. Round…
A: The independent variable is x. The dependent variable is y. We have to compute the least squares…
Q: A researcher records data on / adult pairs' heights (in inches) to compare the physical…
A: In simple linear regression, there will be exactly one independent variable and one dependant…
Q: The following graphs show a least squares regression line plotted to different sets of data. Each of…
A: We use scatter plot to show the direction and pattern of relationship between the variables, to…
Q: Suppose Wesley is a marine biologist who is interested in the relationship between the age and the…
A: Given: Y^ = 8.2052+0.5693X Age of the crab, X = 21.7865 Now, Value of Y^ when X=21.7865 Putting the…
Q: The following table shows students’ test scores on the first two tests in an introductory statistics…
A: The independent variable is First test. The dependent variable is Second test. This is simple linear…
Q: The following data x 1 20 30 40 1 400 800 1300 is regressed with least squares regression to y = a,…
A: Given: x y 1 1 20 400 30 800 40 1300
Q: Suppose we know the following information about a set of bivariate data: = 3.08 =-1.69 1.6 = 5.9…
A:
Q: The table below shows the numbers of new-vehicle sales (in thousands) for Company 1 and Company 2…
A:
Q: A manager wishes to determine the relationship between the number of years her sales representatives…
A: Given Information : A manager wishes to determine the relationship between the number of years her…
Q: Suppose we know the following information about a set of bivariate data: (x²) =17.64 (y²) =3.2 (xy)…
A: Given<x2>=17.64<y2>=3.2<xy>=17.9y=9.3x=-1.2
Q: Suppose Wesley is a marine biologist who is interested in the relationship between the age and the…
A:
Q: Suppose we know the following information about a set of bivariate data: (x²) =9.72 (y²) =10.69 (æy)…
A:
Q: Consider the following data on the number of hours which 10 persons lied for a test and their scores…
A:
Q: A study was conducted to detemine whether a the final grade of a student in an introductory…
A: For the given data Find the least squares line = ? predict y when x = 100

Step by step
Solved in 2 steps with 2 images

- Olympic Pole Vault The graph in Figure 7 indicates that in recent years the winning Olympic men’s pole vault height has fallen below the value predicted by the regression line in Example 2. This might have occurred because when the pole vault was a new event there was much room for improvement in vaulters’ performances, whereas now even the best training can produce only incremental advances. Let’s see whether concentrating on more recent results gives a better predictor of future records. (a) Use the data in Table 2 (page 176) to complete the table of winning pole vault heights shown in the margin. (Note that we are using x=0 to correspond to the year 1972, where this restricted data set begins.) (b) Find the regression line for the data in part ‚(a). (c) Plot the data and the regression line on the same axes. Does the regression line seem to provide a good model for the data? (d) What does the regression line predict as the winning pole vault height for the 2012 Olympics? Compare this predicted value to the actual 2012 winning height of 5.97 m, as described on page 177. Has this new regression line provided a better prediction than the line in Example 2?Suppose Wesley is a marine biologist who is interested in the relationship between the age and the size of male Dungeness crabs. Wesley collects data on 1,000 crabs and uses the data to develop the following least-squares regression line where ? is the age of the crab in months and ?ˆ is the predicted value of ?, the size of the male crab in cm. ?ˆ=8.1312+0.5226? What is the value of ?ˆ when a male crab is 23.0736 months old? Provide your answer with precision to two decimal places. ?ˆ = Interpret the value of ?. The value of ?ˆis the predicted size of a crab when it is 23.0736 months old. the predicted incremental increase in size for every increase in age by 23.0736 months. the predicted number of crabs out of the 1,000 crabs collected that will be 23.0736 months old. the probability that a crab will be 23.0736 months old.Suppose Wesley is a marine biologist who is interested in the relationship between the age and the size of male Dungeness crabs. Wesley collects data on 1,000 crabs and uses the data to develop the following least-squares regression line where ? is the age of the crab in months and ?̂ is the predicted value of ?, the size of the male crab in cm. ?̂=8.2052+0.5693? What is the value of ?̂ when a male crab is 21.7865 months old? Provide your answer with precision to two decimal place
- Suppose the following data were collected from a sample of 5 car manufacturers relating monthly car sales to the number of dealerships and the quarter of the year. Use statistical software to find the following regression equation: SALESi= b0 + b1DEALERSHIPSi + b2 QUARTER1i+ b3QUARTER2i + b4QUARTER3i+ ei Is there enough evidence to support the claim that on average, car sales are higher in the 4th quarter than in the 2nd quarter at the 0.01 level of significance? If yes, write the regression equation in the spaces provided, rounded to two decimal places. Else, select "There is not enough evidence." Monthly Sales Number of Dealerships 1st Quarter (1 if Jan.-Mar., 0 otherwise) 2nd Quarter (1 if Apr.-Jun., 0 otherwise) 3rd Quarter (1 if Jul.-Sep., 0 otherwise) 4th Quarter (1 if Oct.-Dec., 0 otherwise) 85482 4 1 0 0 0 101319 9 1 0 0 0 121389 12 1 0 0 0 133677 18 1 0 0 0 194588 22 1 0 0 0 82128 4 0 1 0 0 150407 9 0 1 0 0 242714 12 0…The following information pertains to a simple least squares regression for DEF Corporation: Mean value of the dependent variable 30Mean value of the independent variable 8Coefficient of the independent variable 3Number of observations 12 What is the "a" value for the leasts-quares regression model? a. 60b. 30c. 6d. 0The following table shows the marks in statistics and economics for ten students. Fit a least square line to the data using a) ‘X’ as the independent variable b) What will be the regression equation if X= 20
- The following table shows the length, in centimeters, of the humerus and the total wingspan, in centimeters, of several pterosaurs, which are extinct flying reptiles. (A graphing calculator is recommended.) (a) Find the equation of the least-squares regression line for the data. (Where × is the independent variable.) Round constants to the nearest hundredth. y= ? (b) Use the equation from part (a) to determine, to the nearest centimeter, the projected wingspan of a pterosaur if its humerus is 52 centimeters. ? cmSuppose Wesley is a marine biologist who is interested in the relationship between the age and the size of male Dungeness crabs. Wesley collects data on 1,000 crabs and uses the data to develop the following least-squares regression line where ?X is the age of the crab in months and ?ˆY^ is the predicted value of ?Y, the size of the male crab in cm. ?ˆ=8.2052+0.5693?Y^=8.2052+0.5693X What is the value of ?ˆY^ when a male crab is 21.7865 months old? Provide your answer with precision to two decimal places. ?ˆ= Interpret the value of ?ˆ. The value of ?ˆ is the predicted number of crabs out of the 1,000 crabs collected that will be 21.7865 months old. the probability that a crab will be 21.7865 months old. the predicted size of a crab when it is 21.7865 months old. the predicted incremental increase in size for every increase in age by 21.7865 months.Suppose Wesley is a marine biologist who is interested in the relationship between the age and the size of male Dungeness crabs. Wesley collects data on 1,000 crabs and uses the data to develop the following least-squares regression line where ?X is the age of the crab in months and ?ˆY^ is the predicted value of ?Y, the size of the male crab in cm. ?ˆ=9.5603+0.3976?Y^=9.5603+0.3976X What is the value of ?ˆY^ when a male crab is 24.9118 months old? Provide your answer with precision to two decimal places. Y=
- The dean of the Business School at a small Florida college wishes to determine whether the grade-point average (GPA) of a graduate student can be used to predict the graduates starting salary. Records for 23 of last year’s Business School graduates were selected and the following least-squares regression line was calculated to predict starting salary (y) from GPA (x) and R2=.78. A) Circle the correct interpretation of R2.\ B) Suppose that you were one of the graduates in the study and the residual was negative. This means thatSuppose Wesley is a marine biologist who is interested in the relationship between the age and the size of male Dungeness crabs. Wesley collects data on 1,000 crabs and uses the data to develop the following least-squares regression line where ?X is the age of the crab in months and ?ˆY^ is the predicted value of ?Y, the size of the male crab in cm. ?ˆ=8.2052+0.5693? What is the value of ?^ when a male crab is 21.7865 months old? Provide your answer with precision to two decimal places. Y^ = Interpret the value of Y^.Following is information on the price per share and the dividend for asample of 30 companies.Company Price per Share Dividend1 $21.00 $ 3.342 23.12 3.56. . .. . .. . .39 81.90 18.5540 84.09 18.26Click here for the Excel Data FileRequired:a. Calculate the regression equation that predicts price per share basedon the annual dividend. (Round your answers to 4 decimal places.) b-1. State the null and alternate hypotheses.H0: β = 0 and H1: β ≠ 0H0: β = 0 and H1: β = 0H0: β ≠ 0 and H1: β ≠ 0H0: β ≤ 0 and H1: β > 0b-2. State the decision rule. Use the 0.05 significance level. (Round your answer to 3 decimal places )Price = 28.2064 + 2.4060 dividend b-2. State the decision rule. Use the 0.05 significance level. (Round your answer to 3 decimal places.) Reject H0 if t is not between ± 2.048 b-3. Compute the value of the test statistic. (Round your answer to 4 decimal places.) The test statistic is 7.3285b-4. What is your decision regarding…
