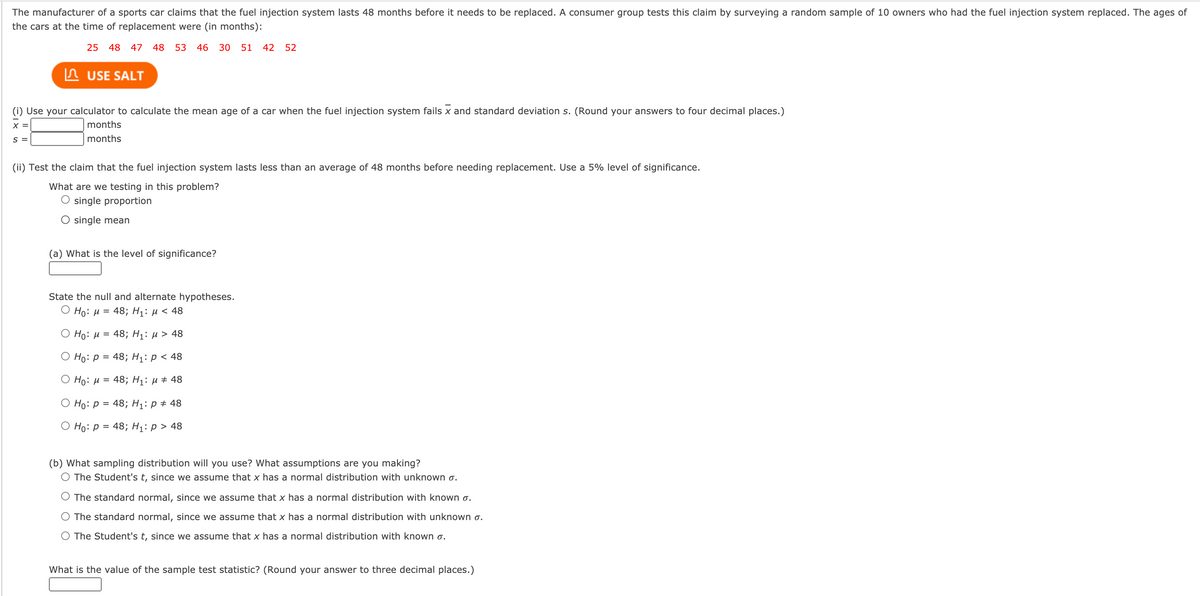
The manufacturer of a sports car claims that the fuel injection system lasts 48 months before it needs to be replaced. A consumer group tests this claim by surveying a random sample of 10 owners who had the fuel injection system replaced. The ages of the cars at the time of replacement were (in months): 25 48 47 48 53 46 30 51 42 52 n USE SALT (1) Use your calculator to calculate the mean age of a car when the fuel injection system fails x ar x =| standard deviation s. (Round your answers to four decimal places.) months months (ii) Test the claim that the fuel injection system lasts less than an average of 48 months before needing replacement. Use a 5% level significance. What are we testing in this problem? O single proportion O single mean (a) What the level of significance? State the null and alternate hypotheses. О Но: и 48; Н,: и < 48 O Ho: H= 48; H: u > 48 O Họ: p = 48; H: p< 48 O Ho: H = 48; H: µ + 48 O Ho: p = 48; H: p + 48 O Ho: p = 48; H: p > 48 (b) What sampling distribution will you use? What assumptions are you making? O The Student's t, since we assume that x has a normal distribution with unknown a. O The standard normal, since we assume that x has a normal distribution with known o. O The standard normal, since we assume that x has a normal distribution with unknown a. O The Student's t, since we assume that x has a normal distribution with known o. What is the value the sample test statistic? (Round your answer to three decimal places.)
The manufacturer of a sports car claims that the fuel injection system lasts 48 months before it needs to be replaced. A consumer group tests this claim by surveying a random sample of 10 owners who had the fuel injection system replaced. The ages of the cars at the time of replacement were (in months): 25 48 47 48 53 46 30 51 42 52 n USE SALT (1) Use your calculator to calculate the mean age of a car when the fuel injection system fails x ar x =| standard deviation s. (Round your answers to four decimal places.) months months (ii) Test the claim that the fuel injection system lasts less than an average of 48 months before needing replacement. Use a 5% level significance. What are we testing in this problem? O single proportion O single mean (a) What the level of significance? State the null and alternate hypotheses. О Но: и 48; Н,: и < 48 O Ho: H= 48; H: u > 48 O Họ: p = 48; H: p< 48 O Ho: H = 48; H: µ + 48 O Ho: p = 48; H: p + 48 O Ho: p = 48; H: p > 48 (b) What sampling distribution will you use? What assumptions are you making? O The Student's t, since we assume that x has a normal distribution with unknown a. O The standard normal, since we assume that x has a normal distribution with known o. O The standard normal, since we assume that x has a normal distribution with unknown a. O The Student's t, since we assume that x has a normal distribution with known o. What is the value the sample test statistic? (Round your answer to three decimal places.)

Glencoe Algebra 1, Student Edition, 9780079039897, 0079039898, 2018
18th Edition
ISBN:9780079039897
Author:Carter
Publisher:Carter
Chapter10: Statistics
Section10.5: Comparing Sets Of Data
Problem 14PPS

Related questions

Question
A single question with sub-parts. Please answer all parts. I appreciate it :(
Transcribed Image Text:The manufacturer of a sports car claims that the fuel injection system lasts 48 months before it needs to be replaced. A consumer group tests this claim by surveying a random sample of 10 owners who had the fuel injection system replaced. The ages of
the cars at the time of replacement were (in months):
25
48 47
48
53 46
30
51 42
52
In USE SALT
(i) Use your calculator to calculate the mean age of a car when the fuel injection system fails x and standard deviation s. (Round your answers to four decimal places.)
X =
months
months
= S
(ii) Test the claim that the fuel injection system lasts less than an average of 48 months before needing replacement. Use a 5% level of significance.
What are we testing in this problem?
O single proportion
O single mean
(a) What is the level of significance?
State the null and alternate hypotheses.
О Но: и %3D 48; Hi: и < 48
О Но: и %3D 48; Hi: и > 48
О Но: р %3D 48; Hi: р < 48
Но: и %3D 48; Hi: и# 48
О Но: р %3D 48;B Hi: р# 48
O Ho: P
= 48; H1: p > 48
(b) What sampling distribution will you use? What assumptions are you making?
O The Student's t, since we assume that x has a normal distribution with unknown o.
O The standard normal, since we assume that x has a normal distribution with known ơ.
O The standard normal, since we assume that x has a normal distribution with unknown o.
O The Student's t, since we assume that x has a normal distribution with known o.
What is the value of the sample test statistic? (Round your answer to three decimal places.)
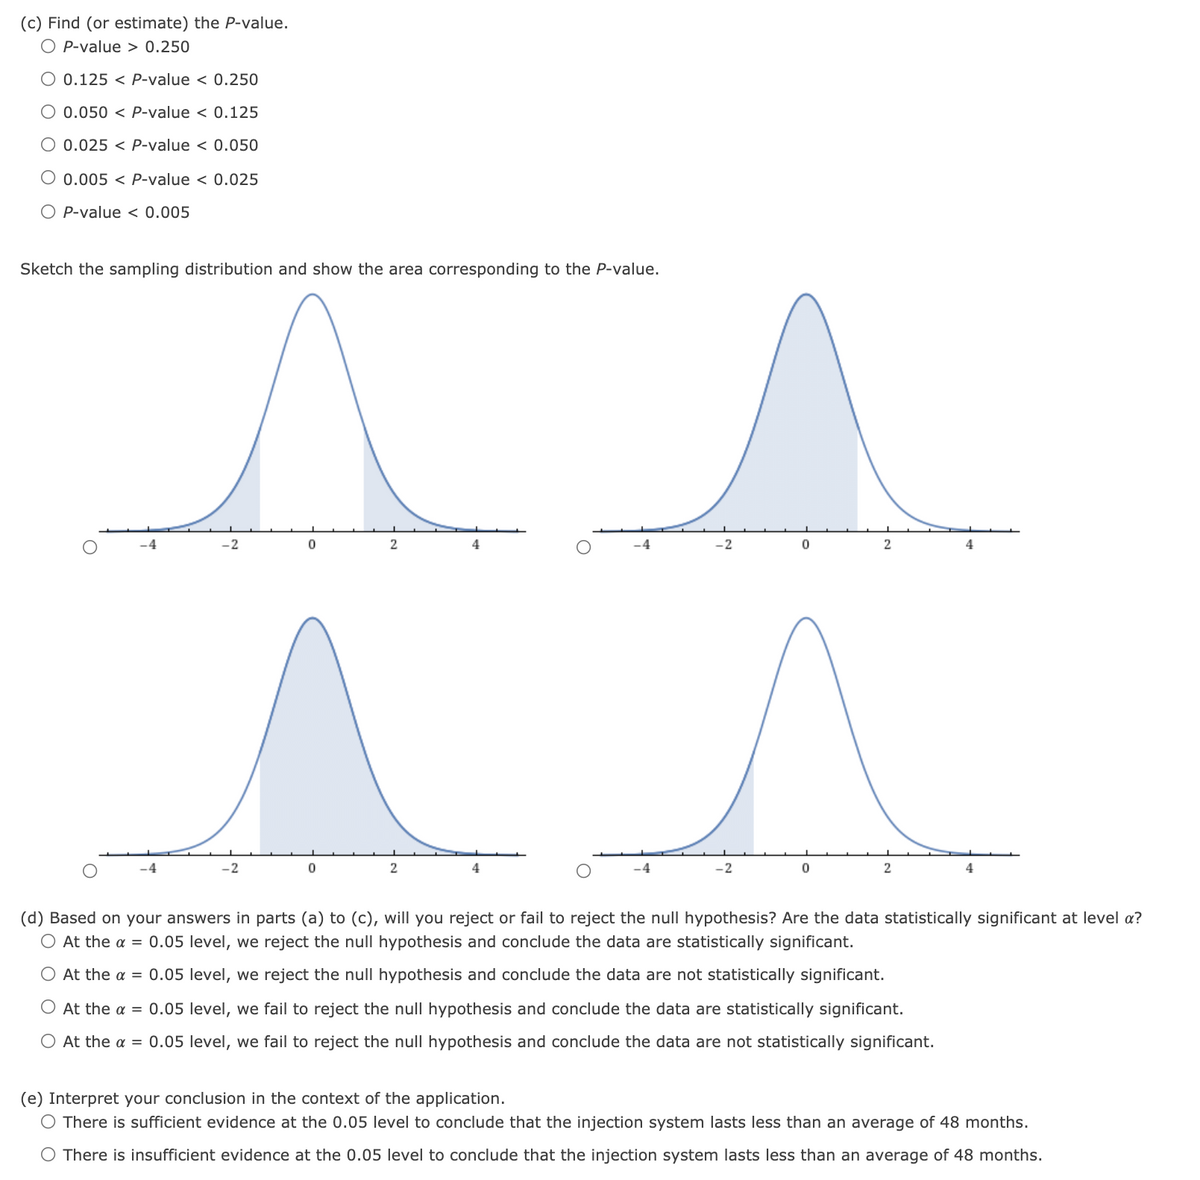
Transcribed Image Text:(c) Find (or estimate) the P-value.
O P-value > 0.250
O 0.125 < P-value < 0.250
O 0.050 < P-value < 0.125
O 0.025 < P-value < 0.050
O 0.005 < P-value < 0.025
O P-value < 0.005
Sketch the sampling distribution and show the area corresponding to the P-value.
-2
4
-4
4
-2
4
-2
4
(d) Based on your answers in parts (a) to (c), will you reject or fail to reject the null hypothesis? Are the data statistically significant at level a?
O At the a = 0.05 level, we reject the null hypothesis and conclude the data are statistically significant.
O At the a = 0.05 level, we reject the null hypothesis and conclude the data are not statistically significant.
At the a = 0.05 level, we fail to reject the null hypothesis and conclude the data are statistically significant.
At the a = 0.05 level, we fail to reject the null hypothesis and conclude the data are not statistically significant.
(e) Interpret your conclusion in the context of the application.
O There is sufficient evidence at the 0.05 level to conclude that the injection system lasts less than an average of 48 months.
O There is insufficient evidence at the 0.05 level to conclude that the injection system lasts less than an average of 48 months.
Expert Solution
This question has been solved!
Explore an expertly crafted, step-by-step solution for a thorough understanding of key concepts.

Step by step
Solved in 3 steps with 3 images

Knowledge Booster


Learn more about
Need a deep-dive on the concept behind this application? Look no further. Learn more about this topic, statistics and related others by exploring similar questions and additional content below.Recommended textbooks for you
Glencoe Algebra 1, Student Edition, 9780079039897…
Algebra
ISBN:
9780079039897
Author:
Carter
Publisher:
McGraw Hill
Glencoe Algebra 1, Student Edition, 9780079039897…
Algebra
ISBN:
9780079039897
Author:
Carter
Publisher:
McGraw Hill