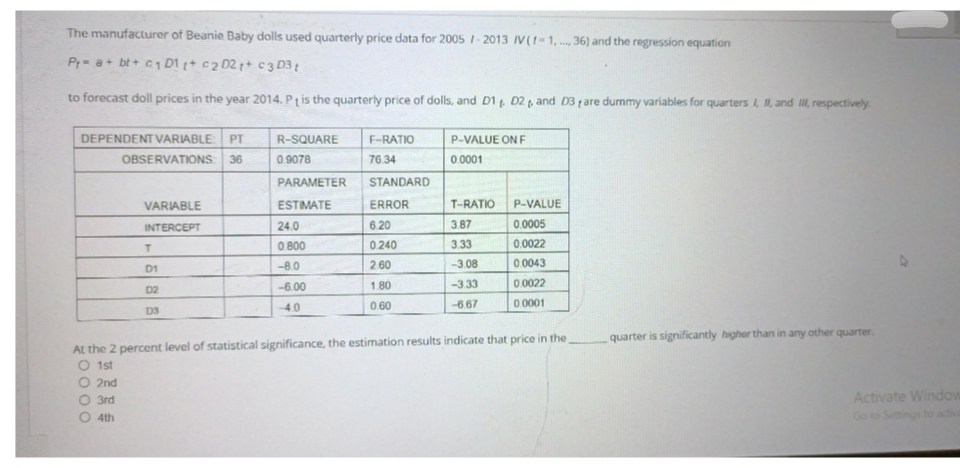
The manufacturer of Beanie Baby dolls used quarterly price data for 2005 / 2013 /V(1-1, 36) and the regression equation Pta+ bt+c₁ D1 1+ c2021+ c3 D3t to forecast doll prices in the year 2014. Pt is the quarterly price of dolls, and D1, D2, and D3, are dummy variables for quarters I, II, and I, respectively.
The manufacturer of Beanie Baby dolls used quarterly price data for 2005 / 2013 /V(1-1, 36) and the regression equation Pta+ bt+c₁ D1 1+ c2021+ c3 D3t to forecast doll prices in the year 2014. Pt is the quarterly price of dolls, and D1, D2, and D3, are dummy variables for quarters I, II, and I, respectively.

MATLAB: An Introduction with Applications
6th Edition
ISBN:9781119256830
Author:Amos Gilat
Publisher:Amos Gilat
Chapter1: Starting With Matlab
Section: Chapter Questions
Problem 1P

Related questions
Question
3
Transcribed Image Text:The manufacturer of Beanie Baby dolls used quarterly price data for 2005 /-2013 /V(-1,..., 36) and the regression equation
Pta+ bt+c₁ D1 + c2 021+ c3 D3 t
to forecast doll prices in the year 2014. Pt is the quarterly price of dolls, and D1, D2, and D3 are dummy variables for quarters I, I, and II, respectively.
DEPENDENT VARIABLE: PT
OBSERVATIONS:
R-SQUARE
0.9078
P-VALUE ON F
0.0001
36
PARAMETER
F-RATIO
76.34
STANDARD
ERROR
6.20
VARIABLE
ESTIMATE
P-VALUE
T-RATIO
3.87
INTERCEPT
24.0
0.0005
T
0.800
0.240
3.33
0.0022
-8.0
D1
2.60
-3.08
0.0043
-6.00
1.80
-3.33
D2
0.0022
0.60
-40
-6.67
D3
0.0001
quarter is significantly higher than in any other quarter.
At the 2 percent level of statistical significance, the estimation results indicate that price in the
O 1st
O 2nd
O 3rd
O 4th
Activate Window
Go to Settings to activa
Expert Solution
This question has been solved!
Explore an expertly crafted, step-by-step solution for a thorough understanding of key concepts.

This is a popular solution!

Trending now
This is a popular solution!

Step by step
Solved in 2 steps

Recommended textbooks for you
MATLAB: An Introduction with Applications
Statistics
ISBN:
9781119256830
Author:
Amos Gilat
Publisher:
John Wiley & Sons Inc

Probability and Statistics for Engineering and th…
Statistics
ISBN:
9781305251809
Author:
Jay L. Devore
Publisher:
Cengage Learning

Statistics for The Behavioral Sciences (MindTap C…
Statistics
ISBN:
9781305504912
Author:
Frederick J Gravetter, Larry B. Wallnau
Publisher:
Cengage Learning
MATLAB: An Introduction with Applications
Statistics
ISBN:
9781119256830
Author:
Amos Gilat
Publisher:
John Wiley & Sons Inc
Probability and Statistics for Engineering and th…
Statistics
ISBN:
9781305251809
Author:
Jay L. Devore
Publisher:
Cengage Learning
Statistics for The Behavioral Sciences (MindTap C…
Statistics
ISBN:
9781305504912
Author:
Frederick J Gravetter, Larry B. Wallnau
Publisher:
Cengage Learning

Elementary Statistics: Picturing the World (7th E…
Statistics
ISBN:
9780134683416
Author:
Ron Larson, Betsy Farber
Publisher:
PEARSON

The Basic Practice of Statistics
Statistics
ISBN:
9781319042578
Author:
David S. Moore, William I. Notz, Michael A. Fligner
Publisher:
W. H. Freeman

Introduction to the Practice of Statistics
Statistics
ISBN:
9781319013387
Author:
David S. Moore, George P. McCabe, Bruce A. Craig
Publisher:
W. H. Freeman