The manufacturer of Beanie Baby dolls used quarterly price data for 2005 /-2013 /V(1= 1,..., 36) and the regression equation Pt= a + bt+ c ₁ D1 t + C₂ D2 ++ c3 D3 t to forecast doll prices in the year 2014. Pt is the quarterly price of dolls, and D1 t, D2 t, and D3 fare dummy variables for quarters I, II, and III, respectively. DEPENDENT VARIABLE: PT OBSERVATIONS: R-SQUARE 0.9078 P-VALUE ON F 0.0001 36 F-RATIO 76.34 STANDARD ERROR PARAMETER ESTIMATE VARIABLE T-RATIO P-VALUE 0.0005 24.0 6.20 INTERCEPT 3.87 0.800 T 0.240 3.33 0.0022 2.60 -8.0 -3.08 0.0043 D1 1.80 -6.00 -3.33 0.0022 D2 0.60 -6.67 0.0001 -4.0 D3 quarter is significantly higher than in any other quarter. At the 2 percent level of statistical significance, the estimation results indicate that price in the O1st O 2nd 3rd 4th Activate Windows Go to Settings to activat
The manufacturer of Beanie Baby dolls used quarterly price data for 2005 /-2013 /V(1= 1,..., 36) and the regression equation Pt= a + bt+ c ₁ D1 t + C₂ D2 ++ c3 D3 t to forecast doll prices in the year 2014. Pt is the quarterly price of dolls, and D1 t, D2 t, and D3 fare dummy variables for quarters I, II, and III, respectively. DEPENDENT VARIABLE: PT OBSERVATIONS: R-SQUARE 0.9078 P-VALUE ON F 0.0001 36 F-RATIO 76.34 STANDARD ERROR PARAMETER ESTIMATE VARIABLE T-RATIO P-VALUE 0.0005 24.0 6.20 INTERCEPT 3.87 0.800 T 0.240 3.33 0.0022 2.60 -8.0 -3.08 0.0043 D1 1.80 -6.00 -3.33 0.0022 D2 0.60 -6.67 0.0001 -4.0 D3 quarter is significantly higher than in any other quarter. At the 2 percent level of statistical significance, the estimation results indicate that price in the O1st O 2nd 3rd 4th Activate Windows Go to Settings to activat

College Algebra
7th Edition
ISBN:9781305115545
Author:James Stewart, Lothar Redlin, Saleem Watson
Publisher:James Stewart, Lothar Redlin, Saleem Watson
Chapter1: Equations And Graphs
Section: Chapter Questions
Problem 10T: Olympic Pole Vault The graph in Figure 7 indicates that in recent years the winning Olympic men’s...

Related questions
Question
5
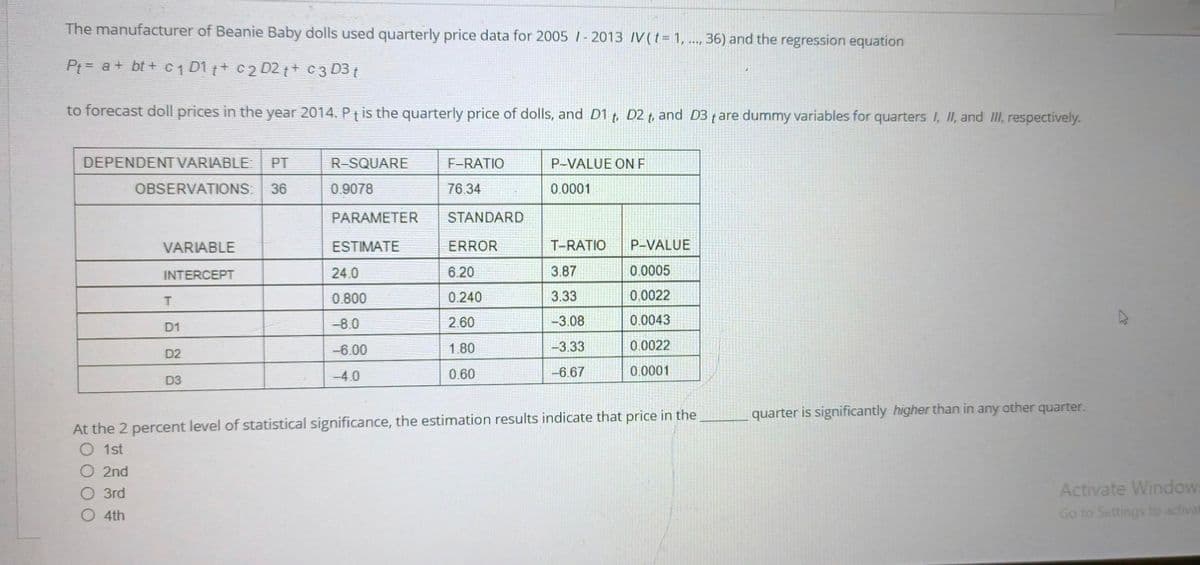
Transcribed Image Text:The manufacturer of Beanie Baby dolls used quarterly price data for 2005 /-2013 /V(t = 1, ..., 36) and the regression equation
Pt= a + bt+ C ₁ D1 t + C₂ D2t+ c3 D3 t
to forecast doll prices in the year 2014. Pt is the quarterly price of dolls, and D1 t, D2 t, and D3 fare dummy variables for quarters I, II, and III, respectively.
DEPENDENT VARIABLE: PT
OBSERVATIONS:
R-SQUARE
0.9078
P-VALUE ON F
0.0001
36
F-RATIO
76.34
STANDARD
ERROR
PARAMETER
VARIABLE
ESTIMATE
T-RATIO
P-VALUE
INTERCEPT
24.0
6.20
3.87
0.0005
T
0.800
0.240
3.33
0.0022
-8.0
2.60
D1
-3.08
0.0043
1.80
-6.00
-3.33
0.0022
D2
0.60
-4.0
-6.67
0.0001
D3
quarter is significantly higher than in any other quarter.
At the 2 percent level of statistical significance, the estimation results indicate that price in the
O 1st
O 2nd
O 3rd
O 4th
Activate Windows
Go to Settings to activat
Expert Solution
This question has been solved!
Explore an expertly crafted, step-by-step solution for a thorough understanding of key concepts.

This is a popular solution!

Trending now
This is a popular solution!

Step by step
Solved in 3 steps with 3 images

Recommended textbooks for you
College Algebra
Algebra
ISBN:
9781305115545
Author:
James Stewart, Lothar Redlin, Saleem Watson
Publisher:
Cengage Learning

Elementary Linear Algebra (MindTap Course List)
Algebra
ISBN:
9781305658004
Author:
Ron Larson
Publisher:
Cengage Learning
College Algebra
Algebra
ISBN:
9781305115545
Author:
James Stewart, Lothar Redlin, Saleem Watson
Publisher:
Cengage Learning
Elementary Linear Algebra (MindTap Course List)
Algebra
ISBN:
9781305658004
Author:
Ron Larson
Publisher:
Cengage Learning