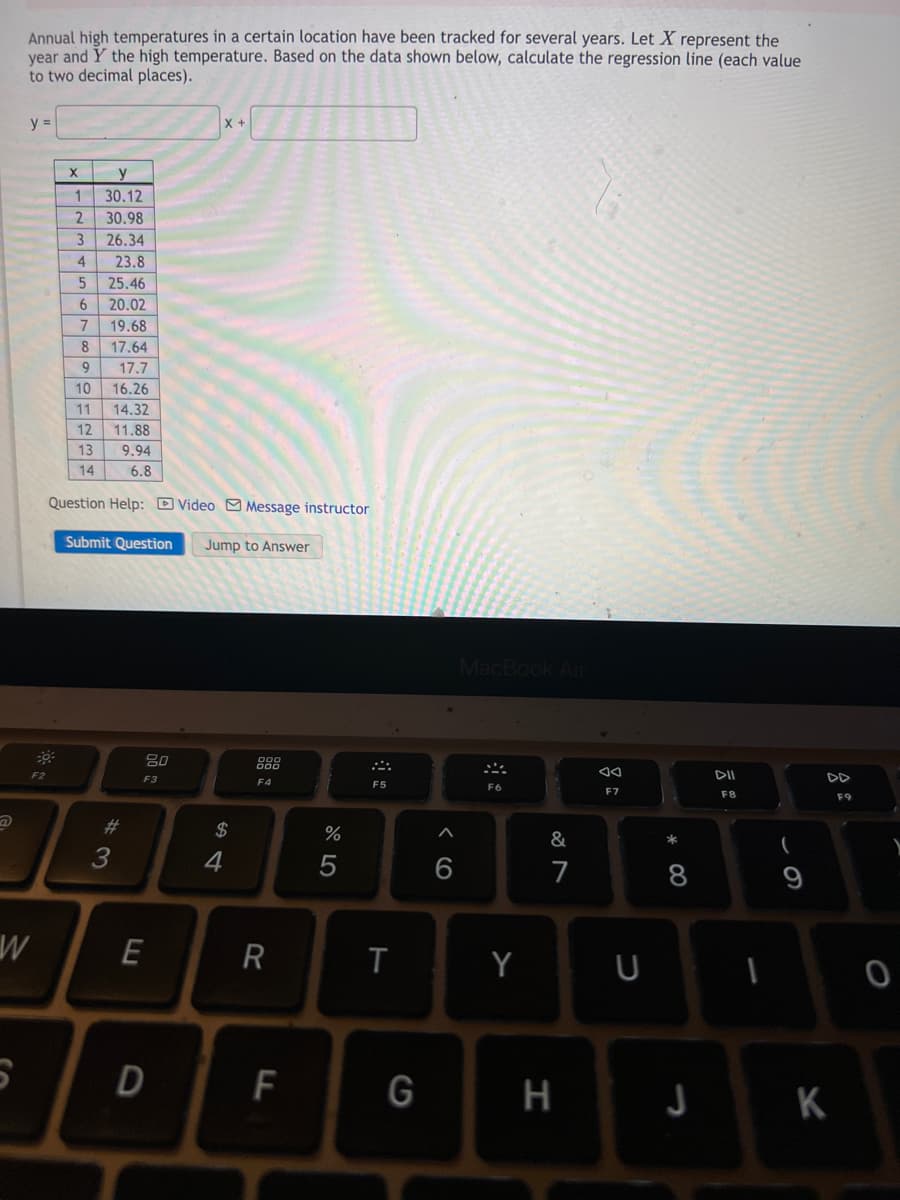
Annual high temperatures in a certain location have been tracked for several years. Let X represent the year and Y the high temperature. Based on the data shown below, calculate the regression line (each value to two decimal places). y = X + y 1 30.12 2 30.98 3 26.34 4 23.8 5 25.46 6 20.02 7 19.68 8 17.64 9 17.7 10 16.26 11 14.32 12 11.88 13 9.94 14 6.8 X 777306


Q: or each of the following, determine if the hypotheses are correctly stated.Check if it's correct if…
A: We know that Null and alternative hypothesis is represented with population parameters not with…
Q: use Lagrange method fixi O 3.7 O 1.3 2 2.5 4.8 - Nm su 6 7 t's 6.2 8.0 9.7 तज् 7.8 3.3 9.2 ㅋ.ㅋ 6.0
A: Solution: From the given information,
Q: The game of Mastermind starts in the following way: One player selects four pegs, each peg having…
A:
Q: 20. In a sample of 1000 voters, a popular mayor. Aira, got 75% of the votes. She is 90% confident of…
A: According to the formula of Margin of Error (MOE) = γ*σ2N where γ= percentile , σ = Standard…
Q: a 90 percent confidence interval for a population mean indicates that
A: Given problem Given that a 90 percent confidence interval for a population mean indicates…
Q: 14. A hypothesis test was performed to test the null hypothesis Ho: μ = 4 against the alternative…
A:
Q: I need help with this
A: Conditional probability is the occurrence of an event assuming that a particular event has already…
Q: The distribution of scores on a standardized aptitude test is approximately normal with a mean of…
A:
Q: 3. The U.S. Department of Agriculture claims that the mean consumption of bottled water by a person…
A: Claim : the mean consumption of bottled water by a person in the United States is 28.5 gallons per…
Q: The accompanying table gives information on the type of coffee selected by someone purchasing a…
A: Probability Probability is a topic of mathematics and statistics associated with predicting the…
Q: Find the mode and the median for the following distribution: Variable 0-5 5-10 10-15 15-20 20-25…
A:
Q: What is the predicted response value? (Report answer accurate to one decimal place.) y =…
A: Given : X Y 43.8 54.1 41.3 51.2 35.3 60.1 48.1 44.9 42.8 51.8 44.7 50.8 39.4…
Q: Find the probability of an event and interpret it
A: I would like probability models to have an interpretation in the real world. Otherwise, what am I…
Q: a) If a man is 6 feet 3 inches tall (75 inches tall), what is his "z-score"? Z = (round to two…
A: It is given that For man: Mean = 69.3 Standard deviation = 2.65 For women: Mean = 64.6 Standard…
Q: The critical value used in constructing a 95% confidence interval is ________. Question 16…
A: It is given that Sample mean = 6 Sample standard deviation = 2 Sample size = 8 Confidence interval…
Q: 36. For the situation above, give a practical interpretation of Bo= -92040 37. For the situation…
A:
Q: Coefficients Term Constant x1 x2 x3 Model Summary S 3.47963 Analysis of Variance Source Regression…
A: The regression equation is given by, Y= β0+β1X1+β2X2+β3X3 Where Y is dependent variable and X1, X2…
Q: Predictions based on a sample taken from a normally distributed population are most reliable when…
A:
Q: A problem with a phone line that prevents a customer from receiving or making calls is upsetting to…
A: Claim : The mean waiting time at Central Office I is different with that at Central Office II.
Q: A computer scientist is investigating the usefulness of two different design languages in improving…
A: Confidence interval is an interval such that the probability of the unknown parameter to be included…
Q: For items 11 to 14: A study was conducted to investigate the interactions between Califórnia…
A:
Q: A sample of 10 adult men gave the following data
A: height weight 62 120 62 140 63 130 65 150 66 142 67 130 68 135 68 175 70 149…
Q: Determine the exact x and y intercepts given the equation of the line and the R². 0 15 20 25 30 35…
A: Given: Equation of line Y = -0.0396X - 3.6556 Coefficient of determination R2 = 0.995
Q: As of April 2006, roughly 50 million.com web domain names were registered (e.g., yahoo.com). (a) How…
A: Disclaimer: Since you have posted a question with multiple sub-parts, we will solve the first three…
Q: Seventy-five percent of the light aircraft that disappear while in flight in a certain country are…
A: Given Seventy-five percent of the light aircrat 69% have an emergency locator 81% of the…
Q: A wildlife management team studied the reproduction rates of deer in three tracts of a wildlife…
A: Solution: As per the guidelines only first three sub parts should be answered. In case other parts…
Q: 3. Given a two-way ANOVA with two levels for factor A, four levels for factor B, and three…
A:
Q: Question 3 John went to the supermarket to check on a few items. The table below shows the…
A: Formula : sample variance :
Q: 8.6. Loss reserves are calculated using the closure method. Trend is 6%. Percentage of claims closed…
A:
Q: 5. The National Collegiate Athletic Association (NCAA) requires Division I athletes to score at…
A:
Q: (No. 1) Given: μ = 48, s = 17, n=25 and x = 65 STATISTICAL TOOL: T-TEST: ONE SAMPLE MEAN Formula:…
A: Comment: As per the our company guidelines we are supposed to answer only one question. Kindly…
Q: A 95 percent confidence interval for the mean of a population is to be constructed and must be…
A: formula for the sample size needed to estimate a population mean is
Q: Suppose that a random sample of 20 recently sold houses in a certain city has a mean sales price of…
A:
Q: Parts of a Statistical Study: In 2010, the Pew Research Center questioned 1700 adults in the U.S. to…
A: Given : In 2010, the Pew Research Center questioned 1700 adults in the U.S. to estimate the…
Q: 2. What is the probability of getting three cards of the same suit when dealt 3 cards from a…
A: 2. There are three cards are selected from standard deck. The possible outcome is (352) There are…
Q: Which statement about the normal distribution is false? Approximately 68 % of the data lie within 1…
A:
Q: 4.4 4) The quality control officer at Spaz Cola uses a systematic random sampling method to select…
A:
Q: The International Average Salary Income Database provides a comparison of average salaries for…
A: Part a. z=x-μσ-0.50=1358.90-μ388.20-194.1=1358.90-μμ=1553 The average salary, then, for accountants…
Q: 2. What is the probability of getting three cards of the same suit when dealt 3 cards from a…
A:
Q: Find the value of z such that P(Z > z) = 0.036. Use two decimal places in your final answer. Sample…
A:
Q: (a) Calculate the sample mean, sample variance, and sample standard deviation for Math101, Math102,…
A: Since you have posted a question with multiple subparts, we will solve first three subparts for you.…
Q: Use this to predict the number of sit ups a person who watches 1.5 hours of TV can do
A: The regression equation is given by y = ax + b = -1.325x + 25.495
Q: Definition: Which of the following is the best definition of a point estimate? O A random guess at…
A: The following statement about the point estimate.
Q: For two independent lives (x) and (y) : t tPx tPxy 1 0.98 0.998 2 0.96 0.990 3 0.90 0.970 4 0.80…
A: Given two independent lives x and y
Q: The following is a list of 6 measurements. 15, 19, 7, 11, 17, 13 Send data to calculator Suppose…
A: The given data is 15, 19, 7, 11, 17, 13
Q: Out of 300 people sampled, 198 had children. Based on this, construct a 90% confidence interval for…
A: Given that Sample size n =300 Favorable cases x =198 Sample proportion p^=x/n =198/300 =0.66
Q: 15. If x₁=Y1+ y2, X2 = y2 + Y3, x3 = y3+y₁, where y₁, y2 y3 are correlated variables each of which…
A:
Q: Question 5 [ Below, we see a snippet of a dataset that consists of 128 observations and 15…
A: Givena)The regression output as shown below In model 1, the dependent variable is Body fat and…
Q: 2. For some time series data y₁, 92, 9120, the sample variance is: 120 1 Σ(yi - g)2 = 1.25 120 and…
A:
Q: Assume the current value of Zt is 165 from a process that has the AR(1) model z = 0.42-1 + a, and…
A: An AR(1) model is a time series, Autoregressive model that forecasts the future value of a variable…


Trending now
This is a popular solution!

Step by step
Solved in 3 steps with 4 images

- Olympic Pole Vault The graph in Figure 7 indicates that in recent years the winning Olympic men’s pole vault height has fallen below the value predicted by the regression line in Example 2. This might have occurred because when the pole vault was a new event there was much room for improvement in vaulters’ performances, whereas now even the best training can produce only incremental advances. Let’s see whether concentrating on more recent results gives a better predictor of future records. (a) Use the data in Table 2 (page 176) to complete the table of winning pole vault heights shown in the margin. (Note that we are using x=0 to correspond to the year 1972, where this restricted data set begins.) (b) Find the regression line for the data in part ‚(a). (c) Plot the data and the regression line on the same axes. Does the regression line seem to provide a good model for the data? (d) What does the regression line predict as the winning pole vault height for the 2012 Olympics? Compare this predicted value to the actual 2012 winning height of 5.97 m, as described on page 177. Has this new regression line provided a better prediction than the line in Example 2?The prelim grades (x) and midterm grades (y) of a sample of 10 MMW students is modeled by the regression line y = 12.0623 + 0.7771x. Estimate the prelim grade if the midterm grade is 83.Annual high temperatures in a certain location have been tracked for several years. Let X represent the year and Y the high temperature. Based on the data shown below, calculate the regression line (each value to two decimal places).y = x + x y 5 8.3 6 9.06 7 9.12 8 11.98 9 8.44 10 12.4 11 9.56 12 11.22 13 10.08 14 10.74
- A marketing manager conducted a study to determine the relationship between money spent on advertising (X) and company sales (Y). The study consisted of 8 companies and the data is given below and is in units of $1000s (ie. 2.4 = $2400.00) d. What is the resulting residual value when advertising expenditure is $2200.00 (X = 2.2), that is the difference between the actual observed value of y and the predicted value of y when using the fitted regression equation? e. What percentage of the variation in company sales is explained by the regression equation? In other words, what is the variability in Y that is due to advertising? Does a…Use the given data to find the scatterplot, equation of the regression line, and prediction. x 1.2 1.4 1.6 1.8 2.0 y 54 53 55 54 56 Let α=0.05 Scatterplot from the calculator: What is the linear regression equation? (Round to 3 decimal places) ^ y= _________________________________________________________________ r = _______________ critical value from table: ________________ Is there a strong enough linear correlation to use the regression equation given? ___________ Explain why? _____________________________________________________ What is the best predicted y-value when x=1.9 ? _______________A grass seed company conducts a study to determine the relationship between the density of seeds planted (in pounds per 500 sq ft) and the quality of the resulting lawn. Eight similar plots of land are selected and each is planted with a particular density of seed. One month later the quality of each lawn is rated on a scale of 0 to 100. The regression equation is given below, where x denotes seed density, and y denotes lawn quality. The correlation coefficient r = .600. y = 33.14 + 4.54x If possible, use the information to obtain an estimate of the mean lawn quality for all lawns sown with a seed density of 4.7 (assume 4.7 is within the domain of the observed seed densities). Pay attention to all details before choosing your answer of the 4 below. Choices: A.) Since the correlation coefficient, r, is less than rcrit = 0.707, the correlation is significant and the lawn quality estimate is 54.48. B.) Since the correlation coefficient, r, is less than rcrit =…
- Annual high temperatures in a certain location have been tracked for several years. Let XX represent the year and YY the high temperature. Based on the data shown below, calculate the regression line (each value to two decimal places).y = x + x y 2 4.13 3 1.72 4 4.21 5 1.9 6 4.69 7 1.68 8 2.27 9 1.86 10 2.25 11 3.14 12 1.53 13 0.72 14 0.51 15 3.5Which of the following best describes a regression coefficient in a bivariate setting? a. The change in Y predicted by a unit change in X b. The slope of a line that minimizes the sum of squared residuals c. The correlation coefficient multiplied by SDy/SDx d. All of the aboveThe height (sidewalk to roof) of notable tall buildings in America is compared to the number of stories of the building (beginning at street level). Stories Height (in feet) 57 1050 28 428 26 362 40 529 60 790 22 401 38 380 110 1454 100 1127 46 700 b. What is your regression line written in the form ŷ = a + bx? (Round a and b to 3 decimal places please!) ŷ = _____ + ______ x b. Use your regression equation above to predict the height of a building with 7070 stories: ________ (Please enter a whole number) c. Compute the coefficient of determination (write it as a decimal here). ___ d. Determine the percentage of the variation in the observed values of the response variable, height, explained by the regression with the explanatory variable, stories. _________%
- A sample consists of 500 houses sold in Karachi between January 2020 and December 2020. The multiple linear regression analysis is carried out to predict the house prices for investment in residential properties in Karachi, Pakistan. The output below is produced using SPSS. Model Unstandardized Coefficients t VIF Constant 14.208 5.736 Age of house -0.299 -2.322 1.58 Square footage of the house 0.364 2.931 1.71 Income of families in the area 0.004 0.392 1.01 Transportation time to major markets -0.337 -2.619 1.90, R2 = 0.67; DW = 2.08 How would you interpret the above ‘Output’ of a regression analysis performed in SPSS?Use the given data to find the equation of the regression line. Round the final values to three significant digits, if necessary. Managers rate employees according to job performance and attitude. The results for several randomly selected employees are given below. Performance Attitute59 7263 6765 7869 8258 7577 8776 9269 8370 8764 78 A. y=11.7+1.02x B. y=2.81+1.35x C. y=−47.3+2.02x D. y=92.3−0.669xAn article reported that for a regression of y = average SAT score on x = expenditure per pupil, based on data from n = 44 New Jersey school districts, a = 766, b = 0.015, r2 = 0.160, and se = 53.7. One observation in the sample was (9400, 897). What average SAT score would you predict for this district, and what is the corresponding residual?Predict average SAT score _______ Residual ________
