The marks obtained by the students in an examination are known to be normally distributed with a mean of 56, and a standard deviation of 10. Calculate the proportion of students that score below 45? 0.03 0.06 0.07 0.01 50000 49601 0.02 0.04 0.05 0.08 0.09 -0 49202 48803 48405 48006 47608 47210 46812 46414 -0.1 46017 45620 45224 44828 44433 44034 43640 43251 42858 42465 -0.2 42074 41683 41294 40905 40517 40129 39743 39358 38974 38591 -0.3 38209 37828 37448 37070 36693 36317 35942 35569 35197 34827 -0.4 34458 34090 33724 33360 32997 32636 32276 31918 31561 31207 -0.5 30854 30503 30153 29806 29460 29116 28774 28434 28096 27760 -0.6 27425 27093 26763 26435 26109 25785 25463 25143 24825 24510 -0.7 24196 23885 23576 23270 22965 22663 22363 22065 21770 21476 -0.8 21186 20897 20611 20327 20045 .19766 .19489 .19215 .18943 .18673 -0.9 .18406 .18141 .17879 .17619 17361 .17106 .16853 .16602 .16354 .16109 -1 .15866 .15625 .15386 .15151 .14917 .14686 .14457 14231 .14007 .13786 -1.1 .13567 13350 .13136 12924 12714 .12507 12302 .12100 .11900 .11702 -1.2 .11507 11314 1123 .10935 .10749 .10565 .10383 .10204 .10027 09853 -1.3 09680 .09510 .09342 .09176 .09012 .08851 .08692 08534 08379 08226 -1.4 08076 .07927 .07780 .07636 07493 07353 .07215 07078 06944 06811 -1.5 06681 06552 .06426 .06301 06178 „06057 .05938 .05821 05705 05592 -1.6 05480 05370 .05262 .05155 05050 .04947 .04846 04746 04648 .04551 -1.7 04457 .04363 .04272 .04182 „04093 .04006 .03920 .03836 .03754 .03673 -1.8 03593 03515 .03438 03362 03288 03216 03144 03074 03005 02938 -1.9 02872 02807 .02743 .02680 02619 02559 .02500 02442 02385 02330 -2 02275 02222 02169 02118 02068 02018 01970 01923 01876 01831 0.86433 O 0.13350 O 0.5 ) 0.13567
The marks obtained by the students in an examination are known to be normally distributed with a mean of 56, and a standard deviation of 10. Calculate the proportion of students that score below 45? 0.03 0.06 0.07 0.01 50000 49601 0.02 0.04 0.05 0.08 0.09 -0 49202 48803 48405 48006 47608 47210 46812 46414 -0.1 46017 45620 45224 44828 44433 44034 43640 43251 42858 42465 -0.2 42074 41683 41294 40905 40517 40129 39743 39358 38974 38591 -0.3 38209 37828 37448 37070 36693 36317 35942 35569 35197 34827 -0.4 34458 34090 33724 33360 32997 32636 32276 31918 31561 31207 -0.5 30854 30503 30153 29806 29460 29116 28774 28434 28096 27760 -0.6 27425 27093 26763 26435 26109 25785 25463 25143 24825 24510 -0.7 24196 23885 23576 23270 22965 22663 22363 22065 21770 21476 -0.8 21186 20897 20611 20327 20045 .19766 .19489 .19215 .18943 .18673 -0.9 .18406 .18141 .17879 .17619 17361 .17106 .16853 .16602 .16354 .16109 -1 .15866 .15625 .15386 .15151 .14917 .14686 .14457 14231 .14007 .13786 -1.1 .13567 13350 .13136 12924 12714 .12507 12302 .12100 .11900 .11702 -1.2 .11507 11314 1123 .10935 .10749 .10565 .10383 .10204 .10027 09853 -1.3 09680 .09510 .09342 .09176 .09012 .08851 .08692 08534 08379 08226 -1.4 08076 .07927 .07780 .07636 07493 07353 .07215 07078 06944 06811 -1.5 06681 06552 .06426 .06301 06178 „06057 .05938 .05821 05705 05592 -1.6 05480 05370 .05262 .05155 05050 .04947 .04846 04746 04648 .04551 -1.7 04457 .04363 .04272 .04182 „04093 .04006 .03920 .03836 .03754 .03673 -1.8 03593 03515 .03438 03362 03288 03216 03144 03074 03005 02938 -1.9 02872 02807 .02743 .02680 02619 02559 .02500 02442 02385 02330 -2 02275 02222 02169 02118 02068 02018 01970 01923 01876 01831 0.86433 O 0.13350 O 0.5 ) 0.13567

MATLAB: An Introduction with Applications
6th Edition
ISBN:9781119256830
Author:Amos Gilat
Publisher:Amos Gilat
Chapter1: Starting With Matlab
Section: Chapter Questions
Problem 1P

Related questions
Question
quality control
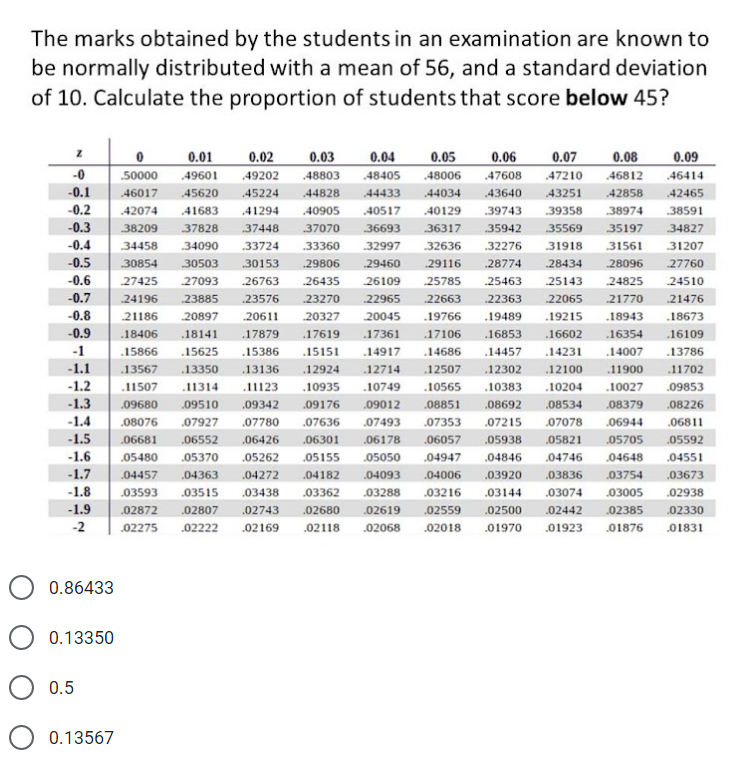
Transcribed Image Text:The marks obtained by the students in an examination are known to
be normally distributed with a mean of 56, and a standard deviation
of 10. Calculate the proportion of students that score below 45?
0.03
0.05
0.06
0.07
47210
0.01
0.02
0.04
0.08
0.09
-0
50000
49601 49202
48803
48405
48006
47608
46812
46414
-0.1
46017
45620
45224
44828
44433
44034
43640
43251
42858
42465
-0.2
42074
41683
41294
40905
40517
40129
.39743
39358
38974
38591
-0.3
38209
37828
37448
37070
36693
36317
35942
35569
35197
34827
-0.4
34458
34090
33724
33360
32997
32636
32276
31918
31561
31207
-0.5
30854
30503
30153
29806
29460
29116
28774
28434
28096
27760
-0.6
27425
27093
26763
26435
26109
25785
.25463
25143
24825
24510
-0.7
24196
23885
23576
23270
22965
22663
22363
22065
21770
21476
-0.8
21186
20897
.20611
20327
20045
.19766
.19489
.19215
.18943
.18673
-0.9
.18406
.18141
.17879
.17619
.17361
.17106
.16853
.16602
.16354
.16109
-1
.15866
.15625
.15386
.15151
.14917
.14686
.14457
.14231
.14007
.13786
-1.1
.13567
.13350
13136
.12924
.12714
.12507
.12302
.12100
.11900
.11702
-1.2
.11507
.11314
.11123
.10935
.10749
.10565
.10383
.10204
.10027
.09853
-1.3
.09680
.09510
.09342
.09176
.09012
.08851
.08692
.08534
.08379
.08226
-1.4
.08076
07927
.07780
.07636
.07493
.07353
.07215
.07078
.06944
.06811
-1.5
.06681
.06552
.06426
.06301
.06178
.06057
.05938
.05821
05705
05592
-1.6
.05480
.05370
.05262
.05155
05050
.04947
.04846
.04746
.04648
.04551
-1.7
.04457
.04363
.04272
.04182
.04093
.04006
.03920
.03836
.03754
.03673
-1.8
03593
.03515
.03438
.03362
03288
.03216
.03144
03074
.03005
.02938
-1.9
02872
.02807
.02743
.02680
.02619
.02559
.02500
.02442
.02385
.02330
-2
02275
.02222
.02169
.02118
.02068
.02018
01970
.01923
01876
01831
0.86433
0.13350
0.5
0.13567
Expert Solution
This question has been solved!
Explore an expertly crafted, step-by-step solution for a thorough understanding of key concepts.

Step by step
Solved in 2 steps

Recommended textbooks for you
MATLAB: An Introduction with Applications
Statistics
ISBN:
9781119256830
Author:
Amos Gilat
Publisher:
John Wiley & Sons Inc

Probability and Statistics for Engineering and th…
Statistics
ISBN:
9781305251809
Author:
Jay L. Devore
Publisher:
Cengage Learning

Statistics for The Behavioral Sciences (MindTap C…
Statistics
ISBN:
9781305504912
Author:
Frederick J Gravetter, Larry B. Wallnau
Publisher:
Cengage Learning
MATLAB: An Introduction with Applications
Statistics
ISBN:
9781119256830
Author:
Amos Gilat
Publisher:
John Wiley & Sons Inc
Probability and Statistics for Engineering and th…
Statistics
ISBN:
9781305251809
Author:
Jay L. Devore
Publisher:
Cengage Learning
Statistics for The Behavioral Sciences (MindTap C…
Statistics
ISBN:
9781305504912
Author:
Frederick J Gravetter, Larry B. Wallnau
Publisher:
Cengage Learning

Elementary Statistics: Picturing the World (7th E…
Statistics
ISBN:
9780134683416
Author:
Ron Larson, Betsy Farber
Publisher:
PEARSON

The Basic Practice of Statistics
Statistics
ISBN:
9781319042578
Author:
David S. Moore, William I. Notz, Michael A. Fligner
Publisher:
W. H. Freeman

Introduction to the Practice of Statistics
Statistics
ISBN:
9781319013387
Author:
David S. Moore, George P. McCabe, Bruce A. Craig
Publisher:
W. H. Freeman