The mass of a whiffle ball varies, usually between 40 and 50 grams. You decide to gather a random sample of whiffle balls and record the mass of each. Your data is displayed in the table below. (Units are grams.) 44.3 46.5 49.6 43.3 41.6 44.9 47.4 46.3 46.3 47.7 44.6 45.1 43.7 46.7 45.3 40.8 47 44 Checksum: 815.1 You would like to describe a "typical" whiffle ball from your data set. You decide to make several calculations describing the "center" of the data set. Find the following: a) mean b) median c) midrange d) 10% trimmed mean e) Which measure of center do you think best describes this data set. Briefly explain your choice.
The mass of a whiffle ball varies, usually between 40 and 50 grams. You decide to gather a random sample of whiffle balls and record the mass of each. Your data is displayed in the table below. (Units are grams.) 44.3 46.5 49.6 43.3 41.6 44.9 47.4 46.3 46.3 47.7 44.6 45.1 43.7 46.7 45.3 40.8 47 44 Checksum: 815.1 You would like to describe a "typical" whiffle ball from your data set. You decide to make several calculations describing the "center" of the data set. Find the following: a) mean b) median c) midrange d) 10% trimmed mean e) Which measure of center do you think best describes this data set. Briefly explain your choice.

Holt Mcdougal Larson Pre-algebra: Student Edition 2012
1st Edition
ISBN:9780547587776
Author:HOLT MCDOUGAL
Publisher:HOLT MCDOUGAL
Chapter11: Data Analysis And Probability
Section11.4: Collecting Data
Problem 15E

Related questions
Topic Video
Question
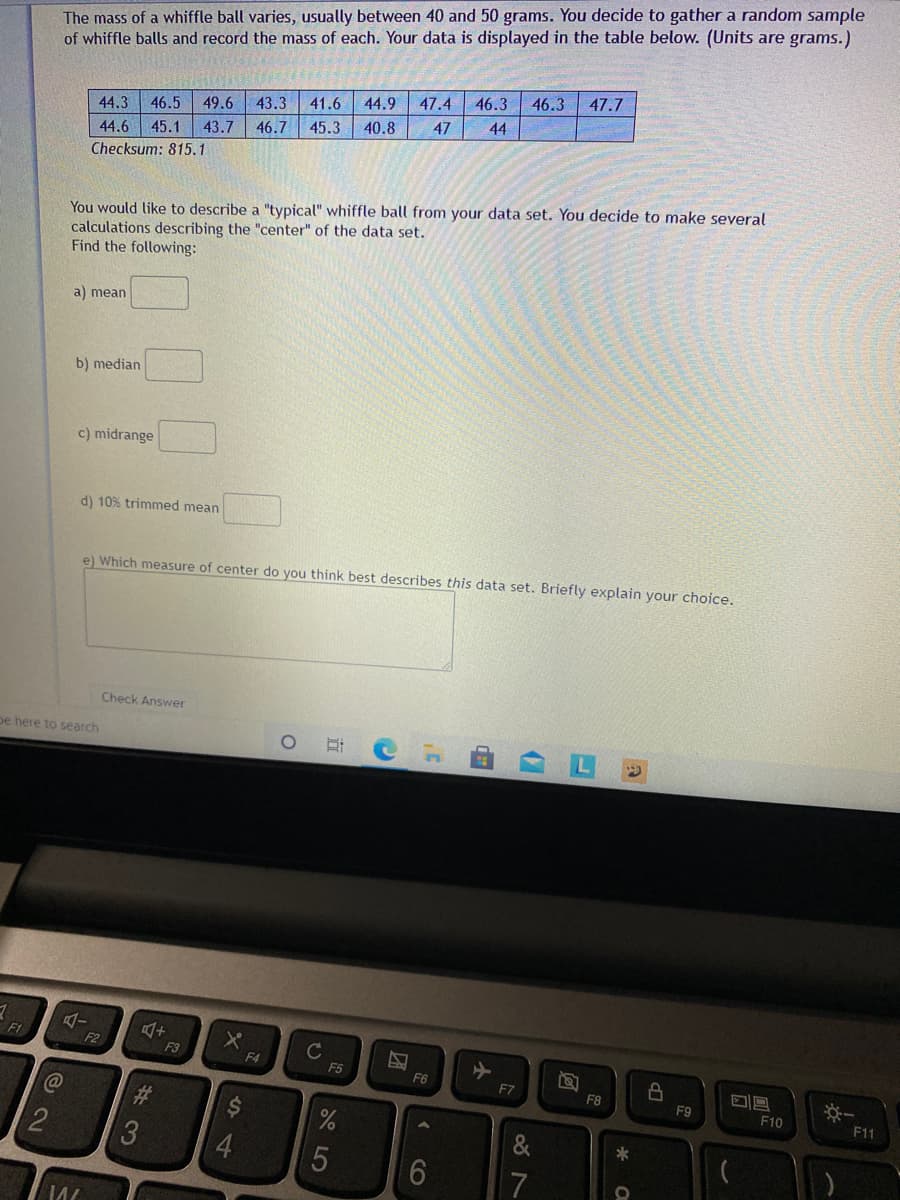
Transcribed Image Text:The mass of a whiffle ball varies, usually between 40 and 50 grams. You decide to gather a random sample
of whiffle balls and record the mass of each. Your data is displayed in the table below. (Units are grams.)
44.9
47.4
46.3
46.3
47.7
44.3
46.5
49.6
43.3
41.6
46.7
45.3
40.8
47
44
44.6
45.1
43.7
Checksum: 815.1
You would like to describe a "typical" whiffle ball from your data set. You decide to make several
calculations describing the "center" of the data set.
Find the following:
a) mean
b) median
c) midrange
d) 10% trimmed mean
e) Which measure of center do you think best describes this data set. Briefly explain your choice.
Check Answer
pe here to search
F1
F2
F3
C
F4
F5
F6
F7
F8
※一
F9
%24
F10
F11
2
&
7
CO
Expert Solution
Step 1
Note:
Hi there! Thank you for posting the question. As there are multiple sub parts, according to our policy we have solved the first three sub parts. If you need help with other sub parts, please re post separately.

Trending now
This is a popular solution!

Step by step
Solved in 2 steps

Knowledge Booster


Learn more about
Need a deep-dive on the concept behind this application? Look no further. Learn more about this topic, probability and related others by exploring similar questions and additional content below.Recommended textbooks for you
Holt Mcdougal Larson Pre-algebra: Student Edition…
Algebra
ISBN:
9780547587776
Author:
HOLT MCDOUGAL
Publisher:
HOLT MCDOUGAL

Big Ideas Math A Bridge To Success Algebra 1: Stu…
Algebra
ISBN:
9781680331141
Author:
HOUGHTON MIFFLIN HARCOURT
Publisher:
Houghton Mifflin Harcourt

Glencoe Algebra 1, Student Edition, 9780079039897…
Algebra
ISBN:
9780079039897
Author:
Carter
Publisher:
McGraw Hill
Holt Mcdougal Larson Pre-algebra: Student Edition…
Algebra
ISBN:
9780547587776
Author:
HOLT MCDOUGAL
Publisher:
HOLT MCDOUGAL
Big Ideas Math A Bridge To Success Algebra 1: Stu…
Algebra
ISBN:
9781680331141
Author:
HOUGHTON MIFFLIN HARCOURT
Publisher:
Houghton Mifflin Harcourt
Glencoe Algebra 1, Student Edition, 9780079039897…
Algebra
ISBN:
9780079039897
Author:
Carter
Publisher:
McGraw Hill