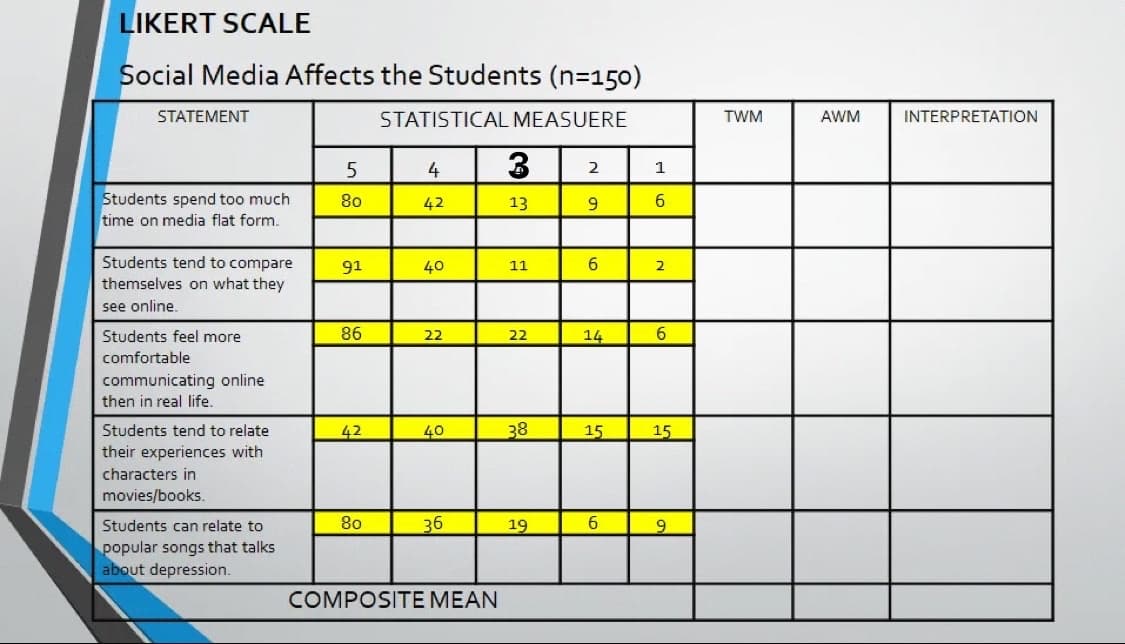
LIKERT SCALE Social Media Affects the Students (n=150) STATEMENT STATISTICAL MEASUERE 5 4 3 2 80 42 13 9 Students spend too much time on media flat form. 91 40 11 6 Students tend to compare themselves on what they see online. 86 22 22 14 Students feel more comfortable communicating online then in real life. 42 40 38 15 Students tend to relate their experiences with characters in movies/books. 80 36 19 6 Students can relate to popular songs that talks about depression. COMPOSITE MEAN 1 6 2 6 15 9 TWM AWM INTERPRETATION


Q: 8) The following gives the national percentages of adults in a given age group. Use Google Sheets or…
A: 8) Given data: Age group 18 - 29 30 - 44 45 - 59 60 or older Percentage 17 27 25 31
Q: It is known that the weights of mangoes harvested in a farm are normally distributed with a mean of…
A:
Q: The average monthly mortgage payment including principal and interest is $982 in the United States.…
A: Given Mean = 982 Standard deviation=180
Q: Bottled Drinking Water Americans drank an average of 23.2 gallons of bottled water per capita in…
A: GivenMean(μ)=23.2standard deviation(σ)=2.7
Q: Sketch a bell curve for the SAT mathematics data with markings on the horizontal axis for the mean,…
A: Solution-: Sketch a bell curve for the SAT mathematics data with markings on the horizontal axis for…
Q: Another experiment on the spacing effect, this time on a watermelon tree, used five different levels…
A: Given: 2x2 2.8x2.8 3x3 3.5x3.5 4x4 7 12 14 19 7 7 17 18 25 10 15 12 18 22 11 11 18 19 19…
Q: On a 9 question multiple-choice test, where each question has 3 answers, what would be the…
A:
Q: Consider a drug testing company that provides a test for marijuana usage. Among 294 tested subjects,…
A: In the given scenario, the test results of marijuana usage were conducted. They found that 29 tests…
Q: Instructions: Kindly compute for the t-test, table, and its interpretation. Raw data is already…
A: Given information: Plate No. Positive Control (mm) – Nystatin Experimental (mm) - Basil leaf…
Q: For a standard normal distribution, find: P(z < 1.3) Express the probability as a decimal rounded…
A:
Q: A prison sentence is less than 13 years? P (X<13) =
A: Given Mu=15 Standard deviations=1.8
Q: Recreational Time A researcher wishes to see if there is a difference between the mean number of…
A: Introduction: Denote μ1, μ2 as the true mean number of hours spent weekly in recreational activities…
Q: Find the t-score for a sample of size 18 taken from a population with mean 9 when the sample mean is…
A: It is given that Population mean = 9 Sample mean = 12 Sample standard deviation = 1.5 Sample size =…
Q: The data below are the scores of the students in the 45-item statistics exam. 16 22 26 28 29 31 35…
A: The given data represents the scores of the students in the 45-item statistics exam. (a) The…
Q: Fill in the blank. A A dis is used to test the hypothesis that an observed frequency distribution…
A:
Q: Given that: Population mean, μ = 8 Sample mean, x = 7.9 Population standard deviation, o = 0.6…
A:
Q: Below is a sample space diagram to show all the possible outcomes when a fair coin and fair…
A: Fair coin and fair six sided die then possible outcomes are S={ (H,1) (H,2) (H,3) (H,4) (H,5) (H,6)…
Q: [S. CEREVISIAE] Instructions: Kindly compute for the t-test, table, and its interpretation. Raw data…
A: Given information: Plate No. Positive Control – Nystatin Experimental - Basil leaf extract…
Q: Assuming that the heights of college women are normally distributed with mean 68 inches and standard…
A: Given Mean=68 Standard deviation=3
Q: Calculate the median for the following data, which represents the time taken to go to work for fifty…
A: Given data is Time spent Repetition Cumulative Repetition 1-10 8 8 11-20 14 22 21-30 12 34…
Q: According to a report published by the USDA 2 years ago, a typical American consumes an average of…
A: Given: Population mean = 31.1 Sample size = 64 Sample mean = 31.65 Sample standard deviation = 2.915…
Q: Below is a graph of a normal distribution with mean μ = -3 and standard deviation o=3. The shaded…
A:
Q: A race director is preparing for an upcoming marathon and estimates that the mean time to finish is…
A:
Q: car manufacturer is concerned about poor customer satisfaction at one of its dealerships. The…
A: The question is about probability distribution Given : No. of customers under survey ( n ) = 60…
Q: a. What is the appropriate test to be used for this study? b. State the Null and Alternative…
A: HERE AS PER POLICY I HAVE CALCULATED 3 SUBPARTS , Here given , 14% of all Americans suffer from…
Q: A local government official observed an increase in the number of individuals with cardiovascular…
A: According to policy we answer 2 part kindly repost for remaining.
Q: Females * = 82.4071 Im 73.2538 Sm= 8.0052 Sf = 9.4446 d the coefficient of variation. Round values…
A: Given that a class of 14 female and 13 male students took exam…
Q: A missile guidance system has nine fail-safe components. The probability of each failing is 0.40.…
A: A missile guidance system has nine fail-safe components; n=9 The probability of each failing is…
Q: What is the lower and upper boundary for a 95% confidence interval for the difference between the…
A:
Q: The probability that a smoke alarm will function properly and sound an alarm in the presence of…
A:
Q: When the following data is displayed in a frequency table of 6 classes, the class length will be:
A: Here number of classes = 6
Q: A sample of 8 adult elephants had an average weight of 12,700 pounds. The standard deviation for the…
A:
Q: A researcher wishes to estimate the proportion of adults who have high speed internet access. What…
A: It is given that margin of error (E) is 0.03 and the confidence level is 0.90.
Q: Hectic Repair Org. HRO) helps repair homes that are structurally weakened by minor earthquakes.…
A: Given that, the estimate of standard time to perform a preliminary damage assessment after an…
Q: Suppose that resting pulse rates among healthy adults are normally distributed with a mean of 75…
A:
Q: Review the information below and select the best choice. Select only one choice. ±σ Mean Time…
A:
Q: You want to obtain a sample to estimate a population mean. Based on previous evidence, you believe…
A:
Q: Ages of Gamblers The mean age of a random sample of 23 people who were playing the slot machines is…
A:
Q: 3. The Los Angeles Times regularly reports the air quality index for various areas of Southern Cal-…
A: Arrange the given data in ascending order28, 42,45,48, 49,50,55,58,60sample size(n)=9
Q: Length of confidence interval=
A: It is given that Population size, n = 22 Standard deviation, s = 4.1 Confidence level = 98%
Q: An apple producer sells their product in bags that each contain 16 apples. These apples have a mean…
A: Hello. Since your question has multiple, we will solve first question for you. If you want remaining…
Q: 1. Given * = 62 and s = 8. Find the z-score value that corresponds to each of the following scores…
A: GivenMean(x)=62standard deviation(s)=8
Q: Assume that females have pulse rates that are normally distributed with a mean of μ = 72.0 beats per…
A: The mean is 72 and the standard deviation is 12.5.
Q: The mean salary of federal government employees on the General Schedule is $59,593. The average…
A: Assume that μ is the population average salary federal government employees on the General Schedule.
Q: The data below are the scores of the students in the 45-item statistics exam. 16 22 26 28 29 31 35…
A: Given information: n=40Ana's score=38
Q: Until your According to a study, brain weights of men in country A are normally distributed with…
A:
Q: In the largest clinical trial ever conducted, 401,974 children were randomly assigned to two groups.…
A:
Q: If the auto parts sales have increased, find the probability that car sales will also increase…
A: The probability that car sales will increase next month is 0.45. The probability that sale of auto…
Q: how many students do we need to construct a 95% confidence interval for the proportion of the…
A: here given , margin of error = 3% = 0.03 confidence level = 95% n = 150 p^= 0.68
Q: A group of 500 students take a survey about distance learning. 150 prefer distance learning. What…
A: The provided information is A group of 500 students take a survey about distance learning. 150…


Trending now
This is a popular solution!

Step by step
Solved in 2 steps

- A video game claims that the drop rate for a certain item is 5% according to a game publisher. In online forums, a number of players are complaining that the drop right seems to be low. In order to test the drop rate claim, 100 players agree to attempt to get the drop, each attempting 10 times. Of the 1000 tries, the item only drops 40 times. Using the approximate test, find a P value associated with this claim:A random sample of students who took the GRE twice found 27 who were coached between tries and 33 who were uncoached. The coached group saw an average improvement of 49 points, with s1 = 59. The uncoached group saw an average improvement of 21 points, with s2 = 52. Is this proof that students who receive coaching see a greater improvement on their second GRE attempt than those who don’t? Use a 0.10 level of signicance.(a) What are the appropriate assumptions for a two-sample hypothesis teston means and are they met?(b) Give the null and alternative hypotheses.(c) What is the test statistic?(d) What is the P-value?(e) Write a brief summary of your conclusion.In a reaction time experiment, participants are asked to press a button as soon as they seea light come on. Is reaction to a red light faster than a green light? 20 volunteers werefirst given a test to a white light. 10 pairs of subjects were made such that each pair hadequal or nearly equal reaction times to the white light. One volunteer in each pair wasthen tested with the red light, the other with the green light. Reaction times are presentedbelowPair Red Green1 208 2052 206 2073 213 2084 210 2115 212 2096 210 2107 211 2128 198 2019 202 20510 204 200Conduct a 6-step hypothesis test to answer the question whether reaction to the red lightis faster than the green light and please solve in excel
- Heights (cm) and weights (kg) are measured for 100 randomly selected adult males, and range from heights of 136 to 192 cm and weights of 39 to 150 kg. Let the predictor variable x be the first variable given. The 100 paired measurements yield x overbar equals 167.79cm, y overbar equals 81.47 kg, requals 0.113 , P-valueequals 0.263, and ModifyingAbove y with caret equalsnegative 107 plus 1.06x. Find the best predicted value of ModifyingAbove y with caret (weight) given an adult male who is 144 cm tall. Use a 0.01 significance level.A researcher is investigating the effect of acupuncture treatment for chronic back pain. A sample of n = 4 participants is obtained from a pain clinic. Each individual ranks the current level of pain and then begins a 8-week treatment. At the end of the program, the pain level is rated again. For this sample, pain level decreased by an average MD = -4.5 points with SS = 27. Can you conclude that acupuncture treatment significantly reduces back pain? Use α = .05.The past records of a supermarket show that its customers spend an averageof $95 per visit at this store. Recently the management of the store initiated a promotionalcampaign according to which each customer receives points based on the total moneyspent at the store, and these points can be used to buy products at the store. Themanagement expects that as a result of this campaign, the customers should beencouraged to spend more money at the store. To check whether this is true, the managerof the store took a sample of 14 customers who visited the store. The following data givethe money (in dollars) spent by these customers at this supermarket during their visits. 109 136 107 116 101 109 110 94 101 97 104 83 67 120Assume that the money spent by all customers at this supermarket has a normaldistribution. Using a 5% significance level, can you conclude that the mean amount ofmoney spent by all customers at this supermarket after the campaign was started is morethan $95?
- A certain basketball team makes 70% of its free throws on average. In a game where the team shoots 40 free throws. what is the approximate probabillity that the number of free throws made by the team wilbe at least 25%Consider ratings of 4 “Agree” or 5 “Strongly Agree” to mean that test takers have obtained a “high” score on a BRS item. Ratings of 1-3 would be considered “low” item scores. Compute the item discrimination index (d) for BRS Item 3. Enter the values below that you obtain from Excel: Total # of test takers N = _______ 25% of the total # of test takers, or # in the Upper 25% group U = _______ # of test takers in the Upper 25% group for BRS total scores who scored high on item 3 = _______ # of test takers in the Lower 25% group for BRS total scores who scored high on item 3 = _______ Item discrimination index d = ________ ID # Item 1 Item 2 Item 3 Item 4 Item 5 Item 6 BRS Total Score 1 1 3 2 3 3 3 2.5 2 5 5 5 5 5 5 5 3 5 4 4 4 2 3 3.666667 4 5 5 4 5 5 5 4.833333 5 4 5 4 4 5 5 4.5 6 4 3 3 2 4 4 3.333333 7 3 5 5 5 5 5 4.666667 8 3 4 3 3 3 3…Suppose you roll a die until the first time you obtain an even number. Let X1 be the total number of times you roll a 1, and let X2 be the total number of times that you roll a 2. Use simulation in R to test if E[X1]=E[X2]. Include a screenshot of the RStudio approach. Hint: It is extremely unlikely that you will roll 30 times before getting the first even number, so you can safely assume that the first even roll occurs inside of 30 rolls. E[X1]=E[X2] or E[X1]≠E[X2]
- Can you help me solve this using R? 1. Medical research has shown that repeated interval for extensions beyond 20 degrees increases the risk of wrist and hand injuries. Each of 24 students at Cornell University used a proposed new computer mouse design, and while using the mouse, each student's wrist extension was recorded. ```{r}wrist <- data.frame(ID = 1:24, extension = c(27, 28, 24, 26, 27, 25, 25, 24, 24, 24, 25, 28, 22, 25, 24, 28, 27, 26, 31, 25, 28, 27, 27, 25))``` i) Compute the mean and standard deviation of the wrist extensions data above. Describe the sample using these summaries. ii) Create a histogram and QQ-plot of the wrist extensions. Is the normality assumption reasonable? iii) Use the data to estimate the mean wrist extension for people using this new mouse design using a 97\% confidence interval. Provide an interpretation of this interval. iv) Use the data to test the hypothesis that the mean wrist extension for people using this new…In a sales pitch TriCon, a strategic security company, claims they have been able to decrease the sales lost to theft in their previous clients by any average of 3%. A sample of quarterly lost sales reports of other companies before and after hiring TriCon is provided below (also available for download here Sales.xlsx). Given σBEFORE = 2.23 and σAFTER = 1.89, at a 5% level of significance can you conclude that, for other companies, hiring TriCon has lead to a reduction in lost sales? YOU CAN ASSUME THE POPULATION TO BE NORMALLY DISTRIBUTED. Quarterly lost sales ($1,000s) Before TriCon Plan After TriCon Plan 5.25 5.1 5.83 3.35 6.14 6.97 5.36 6.39 4.7 6.78 4.86 3.55 5.45 3.32 5.32 6.48 7.76 6.34 6.15 6.34 7.73 3.67 7.78 4.23 7.52 6.11 5.73 4.5 7.36 5.16 7.91 4.41 6.85 4.04 7.02 6.42 7.14 6.01 5.98 3.49 5.09 5.54 5.68 7.7 5.02 4.14 4.29 b) p-value: c) Conclusion:Dr. Abba hypothesizes A physician hypothesizes that males have higher systolic blood pressure than females. that students will rate their life satisfaction lower at the completion of a humanities course. To test this hypothesis, he collects life satisfaction ratings for all students in the course at the start of the semester and again at the end of the semester. Below are the data. What can be concluded with an an α of 0.05? start end 82758281918187767582 91848693908887798887 A) Obtain/compute the appropriate values to make a decision about H0. critical value= t statistic= B) If appropriate, compute the CI. If not appropriate, input "na" for both spaces below. C)Compute the corresponding effect size(s) and indicate magnitude(s).If not appropriate, input and/or select "na" below. d= r2=