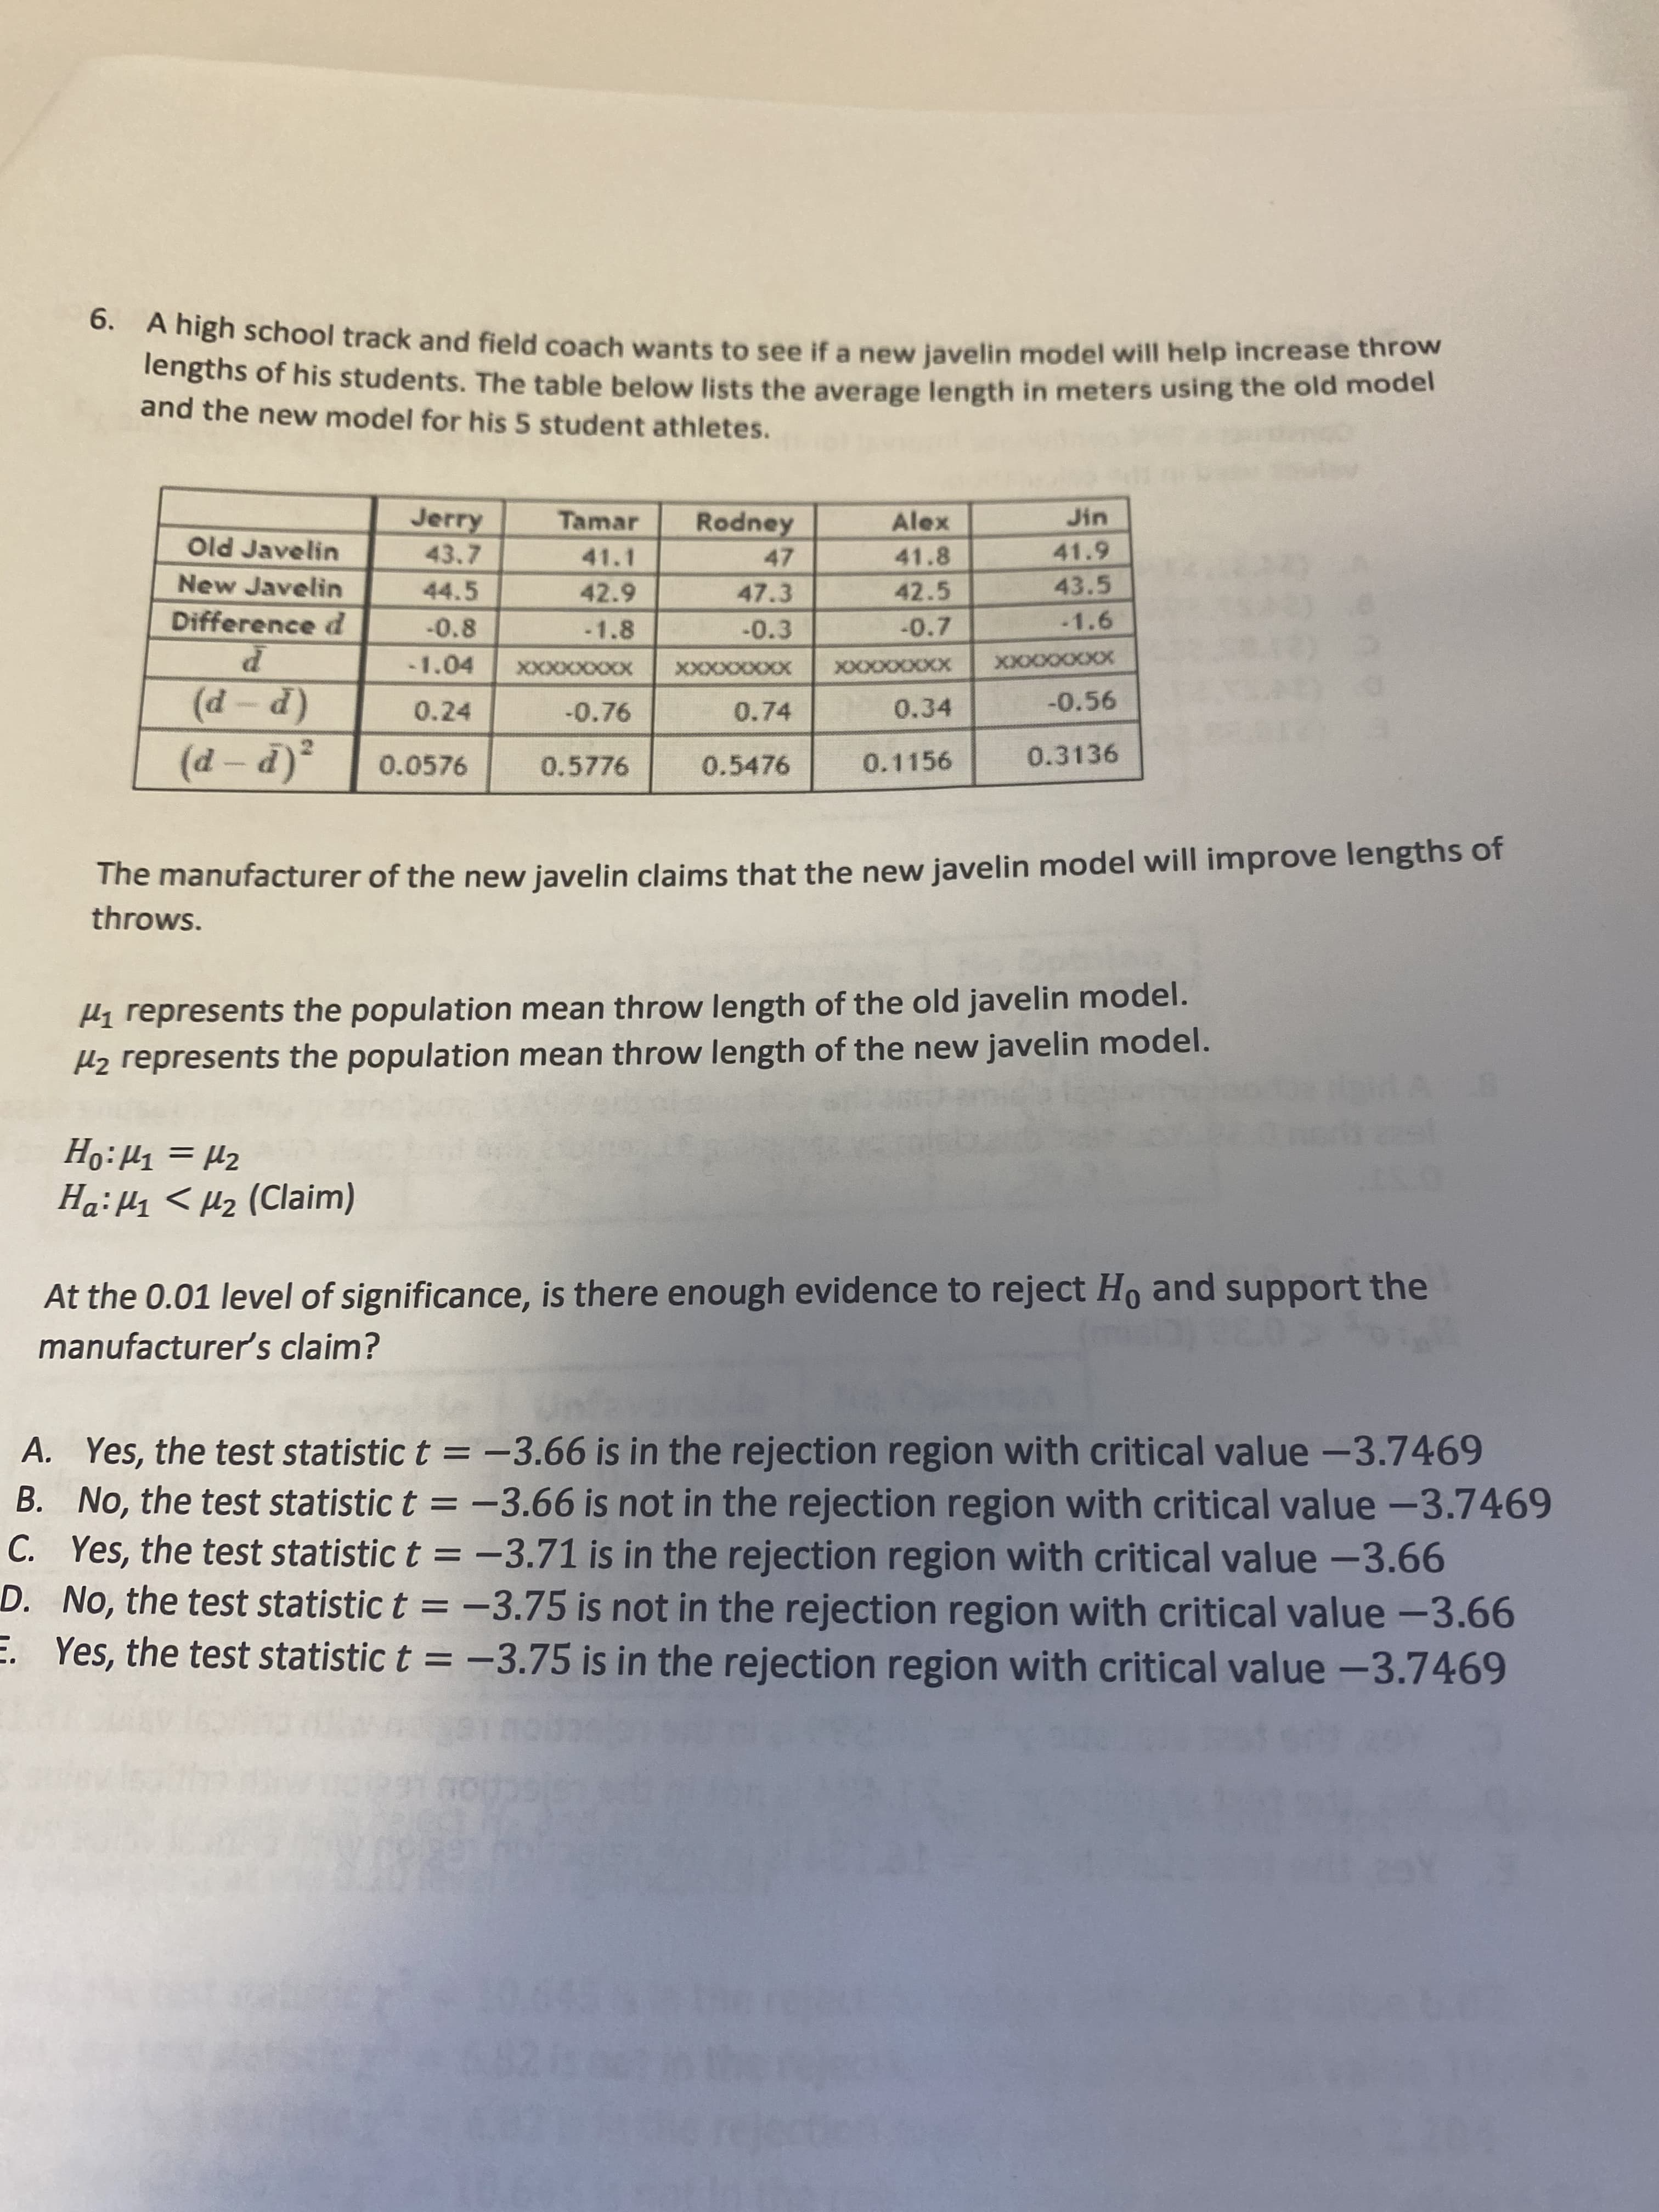
0. A nign School track and field coach wants to see if a new javelin model will help increase throw Tengths of his students. The table below lists the average length in meters using the old model and the new model for his 5 student athletes. Jerry Tamar Rodney Jin Old Javelin 43.7 41.1 47 41.8 41.9 New Javelin 44.5 42.9 47.3 42.5 43.5 Difference d -0.8 -1.8 -0.3 -0.7 -1.6 -1.04 XXXXXXXXX -0.56 XXXXXXXXX XXXXXXXXX XXXXXXXX (P P) 0.0576 0.24 -0.76 0.74 0.34 0.5776 0.5476 0.1156 0.3136 ¿(P - P) The manufacturer of the new javelin claims that the new javelin model will improve lengths of throws. Hi represents the population mean throw length of the old javelin model. Hz represents the population mean throw length of the new javelin model. ZH = In:°H Ha:Hi < Hz (Claim) At the 0.01 level of significance, is there enough evidence to reject Ho and support the manufacturer's claim? A. Yes, the test statistic t = -3.66 is in the rejection region with critical value -3.7469 B. No, the test statistic t = -3.66 is not in the rejection region with critical value -3.7469 C. Yes, the test statistic t = -3.71 is in the rejection region with critical value -3.66 D. No, the test statistic t = -3.75 is not in the rejection region with critical value -3.66 E. Yes, the test statistic t = –3.75 is in the rejection region with critical value -3.7469 |
0. A nign School track and field coach wants to see if a new javelin model will help increase throw Tengths of his students. The table below lists the average length in meters using the old model and the new model for his 5 student athletes. Jerry Tamar Rodney Jin Old Javelin 43.7 41.1 47 41.8 41.9 New Javelin 44.5 42.9 47.3 42.5 43.5 Difference d -0.8 -1.8 -0.3 -0.7 -1.6 -1.04 XXXXXXXXX -0.56 XXXXXXXXX XXXXXXXXX XXXXXXXX (P P) 0.0576 0.24 -0.76 0.74 0.34 0.5776 0.5476 0.1156 0.3136 ¿(P - P) The manufacturer of the new javelin claims that the new javelin model will improve lengths of throws. Hi represents the population mean throw length of the old javelin model. Hz represents the population mean throw length of the new javelin model. ZH = In:°H Ha:Hi < Hz (Claim) At the 0.01 level of significance, is there enough evidence to reject Ho and support the manufacturer's claim? A. Yes, the test statistic t = -3.66 is in the rejection region with critical value -3.7469 B. No, the test statistic t = -3.66 is not in the rejection region with critical value -3.7469 C. Yes, the test statistic t = -3.71 is in the rejection region with critical value -3.66 D. No, the test statistic t = -3.75 is not in the rejection region with critical value -3.66 E. Yes, the test statistic t = –3.75 is in the rejection region with critical value -3.7469 |

Glencoe Algebra 1, Student Edition, 9780079039897, 0079039898, 2018
18th Edition
ISBN:9780079039897
Author:Carter
Publisher:Carter
Chapter10: Statistics
Section10.5: Comparing Sets Of Data
Problem 26PFA

Related questions
Question
Transcribed Image Text:0. A nign School track and field coach wants to see if a new javelin model will help increase throw
Tengths of his students. The table below lists the average length in meters using the old model
and the new model for his 5 student athletes.
Jerry
Tamar
Rodney
Jin
Old Javelin
43.7
41.1
47
41.8
41.9
New Javelin
44.5
42.9
47.3
42.5
43.5
Difference d
-0.8
-1.8
-0.3
-0.7
-1.6
-1.04
XXXXXXXXX
-0.56
XXXXXXXXX
XXXXXXXXX
XXXXXXXX
(P P)
0.0576
0.24
-0.76
0.74
0.34
0.5776
0.5476
0.1156
0.3136
¿(P - P)
The manufacturer of the new javelin claims that the new javelin model will improve lengths of
throws.
Hi represents the population mean throw length of the old javelin model.
Hz represents the population mean throw length of the new javelin model.
ZH = In:°H
Ha:Hi < Hz (Claim)
At the 0.01 level of significance, is there enough evidence to reject Ho and support the
manufacturer's claim?
A. Yes, the test statistic t = -3.66 is in the rejection region with critical value -3.7469
B. No, the test statistic t = -3.66 is not in the rejection region with critical value -3.7469
C. Yes, the test statistic t = -3.71 is in the rejection region with critical value -3.66
D. No, the test statistic t = -3.75 is not in the rejection region with critical value -3.66
E. Yes, the test statistic t = –3.75 is in the rejection region with critical value -3.7469
|
Expert Solution
This question has been solved!
Explore an expertly crafted, step-by-step solution for a thorough understanding of key concepts.

Step by step
Solved in 2 steps with 2 images

Recommended textbooks for you
Glencoe Algebra 1, Student Edition, 9780079039897…
Algebra
ISBN:
9780079039897
Author:
Carter
Publisher:
McGraw Hill

Holt Mcdougal Larson Pre-algebra: Student Edition…
Algebra
ISBN:
9780547587776
Author:
HOLT MCDOUGAL
Publisher:
HOLT MCDOUGAL

Mathematics For Machine Technology
Advanced Math
ISBN:
9781337798310
Author:
Peterson, John.
Publisher:
Cengage Learning,
Glencoe Algebra 1, Student Edition, 9780079039897…
Algebra
ISBN:
9780079039897
Author:
Carter
Publisher:
McGraw Hill
Holt Mcdougal Larson Pre-algebra: Student Edition…
Algebra
ISBN:
9780547587776
Author:
HOLT MCDOUGAL
Publisher:
HOLT MCDOUGAL
Mathematics For Machine Technology
Advanced Math
ISBN:
9781337798310
Author:
Peterson, John.
Publisher:
Cengage Learning,

Algebra: Structure And Method, Book 1
Algebra
ISBN:
9780395977224
Author:
Richard G. Brown, Mary P. Dolciani, Robert H. Sorgenfrey, William L. Cole
Publisher:
McDougal Littell

College Algebra (MindTap Course List)
Algebra
ISBN:
9781305652231
Author:
R. David Gustafson, Jeff Hughes
Publisher:
Cengage Learning