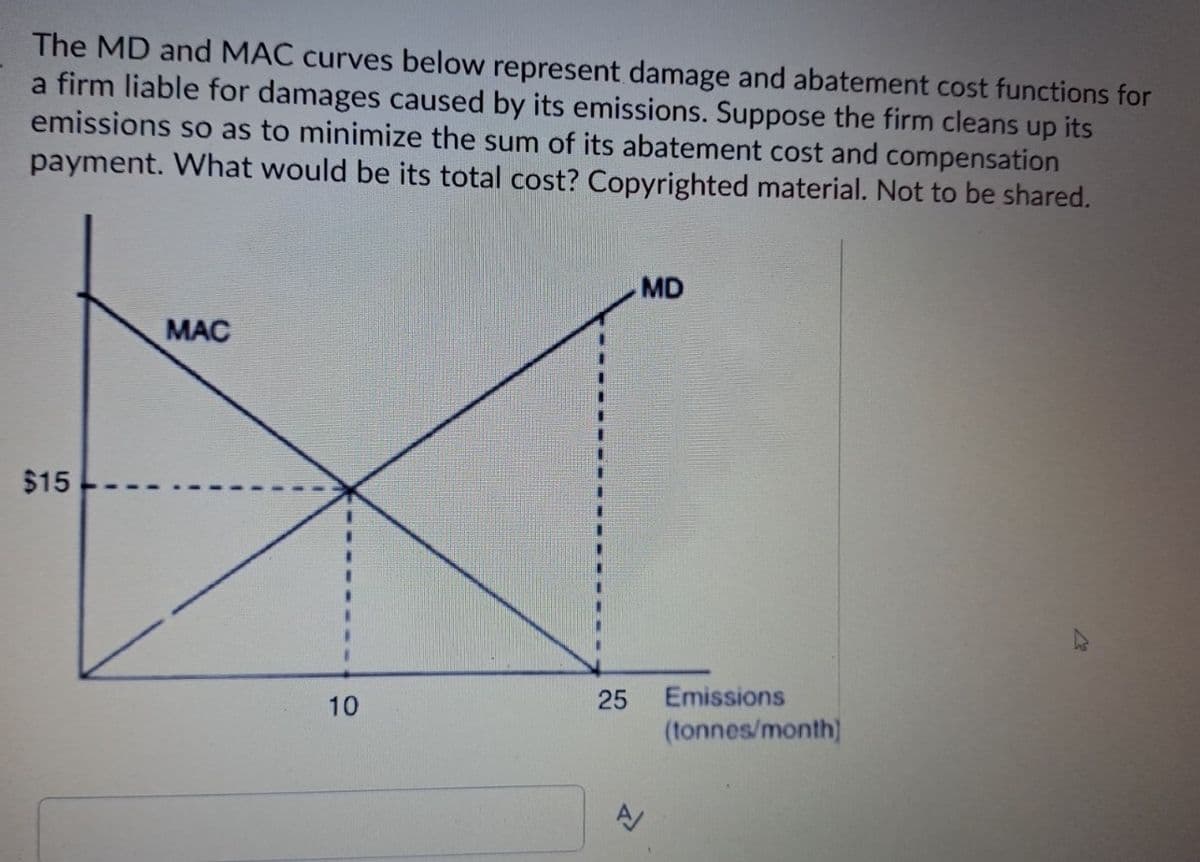
The MD and MAC curves below represent damage and abatement cost functions for a firm liable for damages caused by its emissions. Suppose the firm cleans up its emissions so as to minimize the sum of its abatement cost and compensation payment. What would be its total cost? Copyrighted material. Not to be shared. $15 MAC 10 25 MD A Emissions (tonnes/month)


Q: Consider the following table: Possiblity Pastries Cookies 102 78 || 87 85 III 76 95 This table shows…
A: 17 cookiesExplanation:The opportunity cost of preparing 102 pastries rather than 76 can be…
Q: Suppose that Slovenia and Slovakia both produce sunflowers and glass. Slovenia's opportunity cost of…
A: Second and last option is the correct answer. 7 bushels of sunflowers per pane of glass and 8…
Q: Suppose the government rescinds a business tax that had been used to fund an income assistance…
A: The objective of the question is to understand the implications of the government's decision to…
Q: Discuss THREE monetary strategies currently implemented in the commonwealth of Dominica.
A: The policy controlled by the central bank to promote economic stability by adjusting the interest…
Q: 3. Consider a dynamic (two-period) representative firm's problem. This representative firm is given…
A: The objective of the question is to define the profit functions for a representative firm over two…
Q: - There are 6 cups of espresso (x1) and 6 bars of chocolate (x2) in the house. Andrew and Eric have…
A: Initial endowment refers to the preliminary allocation or ownership of products or assets that each…
Q: Ridgley Custom Metal Products (RCMP) must purchase a new tube bender. RCMP's MARR is 11 percent. The…
A: The objective of the question is to determine which tube bender model (T, A, or X) Ridgley Custom…
Q: 2. According to the graph, answer the following questions about Pencil Sharpeners. Price of Pencil…
A: “Since you have posted multiple questions with multiple sub parts, we will provide the solution only…
Q: Higher education is a place where we see some, but not complete, diversification in investment. That…
A: Student welfare refers to the overall well-being and quality of life experienced by students within…
Q: Using the following table, organize the goods by indicating which you predict to have the most…
A: The elasticity of demand: It is calculated as the proportional change in quantity demanded with…
Q: The demand for commodity X is represented by the equation P = 22 -0.2Q and supply by the equation P…
A: Demand refers to the quantity of a good or service that consumers are willing and able to purchase…
Q: Suppose that with a budget of $210, Fatima spends $126 on sushi and $84 on bagels when sushi costs…
A: Budget constraints shows the relationship between the two goods , their prices and the income of…
Q: 1. The following headline appeared in the London Times, "England's sheep population nearly destroyed…
A: Supply refers to the amount of a good or service that producers are willing and able to sell at a…
Q: Find the Mixed Strategy Nash of the game. Attack -Attack π- C-1, π-C, Attack 2-c -1 -1, 0, -Attack…
A: A Combination Approach When players determine their actions in games using probability, Nash…
Q: 3. How much gross investment is necessary to bring the K/L ratio back to its original level? a. what…
A: Gross investment refers to the funds invested by the firm in acquiring the new or the replacement of…
Q: Firms in the country of Merka, which experiences varying levels of unemployment over time, face a…
A: The unemployment rate is the percentage of the total labor force that is unemployed but actively…
Q: The demand curve for original Iguanawoman comics is given by q = (403-p)^2/100 (0 ≤ p ≤ 403),…
A: Demand Equation:- q = (403-p)^2/100. (0 ≤ p ≤ 403),
Q: ing tables show how much be left with each country after trade and now these two countnes will she…
A: Comparative advantage explains how trade can benefit all parties involved, even when one party is…
Q: Calculate the Elasticity Coefficient for the following scenario. Patty bakes pies, she sells them…
A: Price Elasticity of Demand measures the percentage change in the quantity demanded of a good or…
Q: Pierre Rizzo is considering purchasing a new car. The price of the car is $60000, and Pierre hopes…
A: FIXED COST:It may be defined as the cost that is not dependent on the number of goods produced. It…
Q: Suppose that the marginal product of labor for a local bakery is 120 units per day and the price of…
A: The least cost combination of factors of production is the quantity of each input that the firms…
Q: Consider the economy of Cocoland, where citizens consume only coconuts. Assume that coconuts are…
A: The marginal tax rate refers to the increased taxes paid by the individual on every increased dollar…
Q: When Raising Cane’s Chicken Fingers restaurant opened in East Lansing, a line of 400 customers…
A: The issue here is to dissect a situation including financial dynamic standards connected with…
Q: Assume a production function is Cobb - Douglas in capital and labour. Y = ZF(K, N) = zK\alpha…
A: The objective of the question is to understand the Cobb-Douglas production function and its…
Q: the profit Drive the first order Condition Maximization for Intermediate good produce with respect…
A: Profit maximization is a financial concept that refers to the method through which a company or…
Q: Give arguments in favor of against the following statements. a) In case of two goods model,…
A: Consumer theory is essential in economics because it investigates how customers might maximize…
Q: I have always asked questions like that. Those questions related!! I can't ask them separatly.
A: The demand curve shows an inverse relationship between price and quantity demanded. Demand is a…
Q: find all Nash equilibria in this game using von Neumann-Morgenstern preferences:
A: A game involving buyers (B) and sellers (S) involves two players, each with their own preferences…
Q: An analyst for FoodMax estimates that the demand for its "Brand X" potato chips is given by: In…
A: A demand function is a mathematical equation that shows the relationship between the price of a good…
Q: Karen goes to the casino with 1000$ and plays the following strategy: In her first game, she puts in…
A: Karen has $1000 and visits the Casino. $1 is invested in the first game and if she wins then the…
Q: Consider a firm that emits pollution into the air. Suppose that the marginal damage costs associated…
A: A negative externality occurs when the production or consumption of a good or service imposes costs…
Q: A firm has two factories characterized by the following total cost functions: F1(y1)=3y², F2(y2) =…
A: The entire amount of money spent to produce a certain commodity or unit is referred to as total…
Q: Price level LRAS D B E n SRAS AD3 AD₂ AD₁ Real GDP Refer to Figure 16-1. Suppose the economy is in a…
A: In the AD-AS model, the short-run equilibrium arises where the aggregate output demanded and the…
Q: (a) Derive an expression for the equilibrium level of output. What is the government expenditure…
A: Macroeconomics examines the working, composition, and dynamics of an economy. To comprehend and…
Q: Change in business inventories 50 Compensation of employees 5,400 Corporate profits 700 Durable…
A: Personal Income (PI) represents the total income received by individuals prior to the deduction of…
Q: What is one negative aspect of technology on productivity? Technology allows…
A: The question is asking about the potential negative impacts of technology on productivity. While…
Q: Five mutually exclusive alternatives are being considered for providing a sewage- treatment…
A: The Benefit-to-Cost Ratio (B-C ratio) is an economic metric used to assess the desirability of a…
Q: $1 (x1, x2) = 3x1 3x1+x2 x2 and 82(x1, x2): = 3x1+x2 If both contributions are zero, then s₁ = 82 =…
A: Given,When the firms contributes 0,
Q: For public goods such as bus service, sewage services, power grids, water systems, roads, vaccines,…
A: Public goods are commodities that is available for every individual in the society. The usage of…
Q: Required information The tabulation of the incremental cash flows between alternatives A and B is…
A: Investment describes the allocation of resources like money, time, or effort into assets or projects…
Q: 8.3 The long-run total cost function for a firm producing skateboards is TC=q^3-30q^2+350q, where q…
A: a. Increasing rate of growth as output increases.b. U-shaped graph for the average cost function.…
Q: What would be appropriate government action to close an inflationary gap? Multiple Choice Use policy…
A: An inflationary gap arises in an economy when total spending (aggregate demand) outstrips the total…
Q: A company makes and sells toasters. To make the toasters there is a fixed monthly cost of $27,000…
A: Here we have to write the cost function, the revenue function, the profit function, the break even…
Q: Five mutually exclusive alternatives are being considered for providing a sewage- treatment…
A: The objective of the question is to determine which of the five alternatives should be adopted based…
Q: Price ($/gallon) 2 1- 5 6 Demand for Milk in Smalltown USA Fill in the Blank Question Demand 2 3 5 6…
A: Demand curve is the downward - sloping curve. Demand schedule is the tabular representation of…
Q: Suppose that during the past year, the price of a virtual reality headset fell from $4,350 to…
A: The price of virtual reality headsets decreased by approximately 9.66% from $4,350 to $3,930, and by…
Q: Suppose that the government allows a natural monopoly market structure to exist in the petroleum…
A: Monopoly market structure arises when a single firm is entrenched within an identified sector of the…
Q: consumers
A: Diamond and Dybvig (1983) is a seminal paper within the field of monetary economics that added a…
Q: J Copyright © McGraw-Hill Education. Permission is granted to reproduce for classroom use. NAME DATE…
A: The first question is asking why large candy manufacturers like Hershey's, Mars, and Nestle can…
Q: Paducah Slugger Company makes baseball bats out of lumber supplied to it by Acme Sporting Goods,…
A: (a) The completed table is given below: Q (bats per dayNumber of employeeTotal revenueTotal labor…


Trending now
This is a popular solution!

Step by step
Solved in 1 steps

- Suppose the aggregate MAC function is 100 - 20W and aggregate MD = 5W for a polluting industry. What would the polluting industry's total abatement costs equal if it faced an emissions tax rate equal to 20 dollars per unit emitted? A. 60 B. 20 C. 10 D. 0Owning, operating, and maintaining an automobile carries with it private internal costs to the driver, as well as public external societal costs. List five internal and external costsHow much carbon dioxide would you prevent from entering the atmosphere in one year if you replace a 100 w light bulb with a CFL light bulb that uses 30 watts and they fix your that you have on 8 hours per day round the answer to the hundredth place. Your friend uses 5.5 gallons of gas each month mowing his lawn approximately how much CO2 pollution does it cause per month. How much does it create per year. Assuming he mows 6 months per year.
- Gooey Bites sells snack packs for $3 per pack. Variable expenses involved in producing snack packs are estimated to be $1 per pack and fixed costs for operating the production line are estimated to be $14,000. How many snack packs must Gooey Bites sell to break even? a. 14,000 b. 3,500 c. 4,667 d. 7,000A large sewer system will cost P180,000 annually. There will be favorable consequence to the general public of P520,000 annually, and adverse consequence to a small segment of the public of P60,000 annually. What is the excess of benefits over cost?Your company wants to do their part to reduce pollution. They commit to reducing their greenhouse gasses by 12 tons per year. The company can pay for a reforestation project carbon offset at $8 per ton. Or you can modify your production by abating a ton of pollution.The marginal cost of abating the first ton of greenhouse pollution is $4 with each additionalabated ton costing $1 more (i.e. $5,$6, etc). How much will it cost in total to abate the 12 tons without using the reforestation offsets? What is the best combination, cost wise, using abatement and reforestation offsets? How much does the company save by using the offsets?
- A producer of certified organic fresh basil leaves gets the yield presented in the table below based on weekly working hours. From experience, he knows he will harvest many pounds as he increases the working hours as shown in the below table. This producer is a price taker. Because of the quality of his fresh basil, he contracts his production with a top restaurant at $14.0 per lb. while paying $ 28 per working hour. The total fixed cost is $65. Weekly Working hours (input) Change in input used Yield in lb. (TPP) Change in TPP APP MPP Total Revenue Product (TRP) Total factor cost (TFC) Profit MRP MFC 0 0 10 32 20 68 30 108 40 144 50 176 60 196 70 212…Assume that you are approached to assess a venture of building another bridge. Which of the following factors is the LEAST important in terms of engineering economics. a. number of vehicles in the city b. current interest rate c. cost structure d. service life of the bridgeConsider being tasked with conducting a cost-benefit analysis of a potential coal-fired power station. A specific amount of pollutants will be released from the facility, which will be erected on the fringes of a residential area. Its cooling system will require a considerable volume of water. Industries in the area claim that the extra electricity is urgently needed, while locals are against the building. How would you assess the economic benefits vs the social and environmental costs?
- When we talk about massive energy generation through more traditional methods, such as hydroelectric andthermoelectric plants, it is inevitable that we think about environmental aspects and the entire chain involved so that theenergy generated in a locality is taken to large consumer centers. Seeking to improve thisIn this context, microgrids emerged, which can act in isolation or connected to the Interconnected SystemNational. For consumers, the main advantages are medium-term savings and the issue ofenvironmental. For the distributor, the impacts of microgrids are:ALTERNATIVESa) Practically non-existent, as current equipment is energy efficient and connecteddigitally, improving the operation of the network as a whole.b) Technical and environmental, as the consumer stops buying energy from the distributor, and the generation andtransmission becomes obsolete, generating waste for the environment.c) Exclusively technical, as the consumer connects the phases and the neutral to the SIN…Amex Toy Makers, Inc. markets toys they know pose a possible serious hazard to children under certain circumstances. Does Amex have an ethical duty to remove the toys from the market, even if the injuries only occur in a limited number and only when misused? Why or why not? Explain your answr.r.During your first month as an employee at Engro. Industries (a large drill-bit manufacturer),you are asked to evaluate alternatives for producing a newly designed drill bit on a turningmachine. Your boss’ memorandum to you has practically no information about what thealternatives are and what criteria should be used. The same task was posed to a previousemployee who could not finish the analysis, but she has given you the following information:An old turning machine valued at $350,000 exists (in the warehouse) that can be modified forthe new drill bit. The in-house technicians have given an estimate of $40,000 to modify thismachine, and they assure you that they will have the machine ready before the projected startdate (although they have never done any modifications of this type). It is hoped that the oldturning machine will be able to meet production requirements at full capacity. An outsidecompany, Descon Engg. Inc., made the machine seven years ago and can easily do the…