The mean body mass index (BMI) in patients free of diabetes was reported as 28. An investigator conducting the study hypothesizes that the BMI in patients free of diabetes is different than 28. Based on the data found in a simple random sample of n=12, the mean and standard deviation of BMI were found to be 32 and 6, respectively. Based on this is there evidence that the BMI is significantly different than 28? Use a 5% level of significance? Note: Round your answers to three decimals. None of these choices are correct. T-stat 2.310, T-critical value = 2.201. Since 2.310> 2.201 Reject Ho. T-stat 2.201, T-critical Value = 2.310. Do = not reject HO since 2.210 < 2.310. O T-stat 2.310, T-critical value = = 2.179. Reject HO since 2.310 > 2.179.
The mean body mass index (BMI) in patients free of diabetes was reported as 28. An investigator conducting the study hypothesizes that the BMI in patients free of diabetes is different than 28. Based on the data found in a simple random sample of n=12, the mean and standard deviation of BMI were found to be 32 and 6, respectively. Based on this is there evidence that the BMI is significantly different than 28? Use a 5% level of significance? Note: Round your answers to three decimals. None of these choices are correct. T-stat 2.310, T-critical value = 2.201. Since 2.310> 2.201 Reject Ho. T-stat 2.201, T-critical Value = 2.310. Do = not reject HO since 2.210 < 2.310. O T-stat 2.310, T-critical value = = 2.179. Reject HO since 2.310 > 2.179.

MATLAB: An Introduction with Applications
6th Edition
ISBN:9781119256830
Author:Amos Gilat
Publisher:Amos Gilat
Chapter1: Starting With Matlab
Section: Chapter Questions
Problem 1P

Related questions
Question
100%
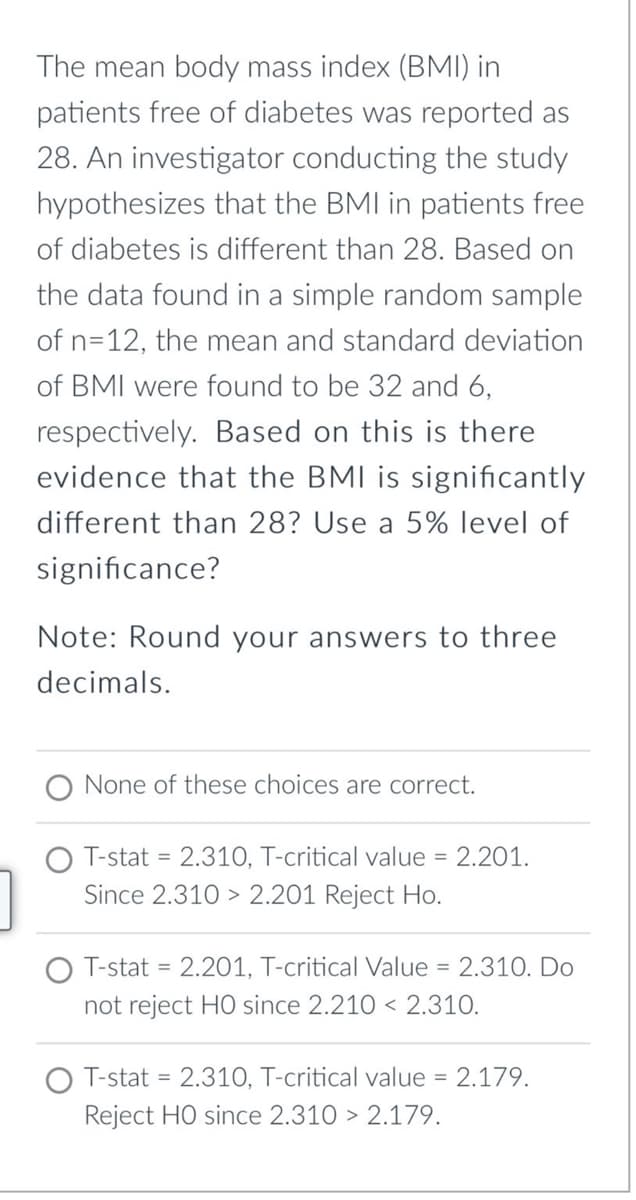
Transcribed Image Text:The mean body mass index (BMI) in
patients free of diabetes was reported as
28. An investigator conducting the study
hypothesizes that the BMI in patients free
of diabetes is different than 28. Based on
the data found in a simple random sample
of n=12, the mean and standard deviation
of BMI were found to be 32 and 6,
respectively. Based on this is there
evidence that the BMI is significantly
different than 28? Use a 5% level of
significance?
Note: Round your answers to three
decimals.
None of these choices are correct.
T-stat = 2.310, T-critical value = 2.201.
Since 2.310> 2.201 Reject Ho.
T-stat 2.201, T-critical Value
=
= 2.310. Do
not reject HO since 2.210 2.310.
T-stat = 2.310, T-critical value = 2.179.
Reject HO since 2.310 > 2.179.
Expert Solution
This question has been solved!
Explore an expertly crafted, step-by-step solution for a thorough understanding of key concepts.

This is a popular solution!

Trending now
This is a popular solution!

Step by step
Solved in 3 steps with 4 images

Recommended textbooks for you
MATLAB: An Introduction with Applications
Statistics
ISBN:
9781119256830
Author:
Amos Gilat
Publisher:
John Wiley & Sons Inc

Probability and Statistics for Engineering and th…
Statistics
ISBN:
9781305251809
Author:
Jay L. Devore
Publisher:
Cengage Learning

Statistics for The Behavioral Sciences (MindTap C…
Statistics
ISBN:
9781305504912
Author:
Frederick J Gravetter, Larry B. Wallnau
Publisher:
Cengage Learning
MATLAB: An Introduction with Applications
Statistics
ISBN:
9781119256830
Author:
Amos Gilat
Publisher:
John Wiley & Sons Inc
Probability and Statistics for Engineering and th…
Statistics
ISBN:
9781305251809
Author:
Jay L. Devore
Publisher:
Cengage Learning
Statistics for The Behavioral Sciences (MindTap C…
Statistics
ISBN:
9781305504912
Author:
Frederick J Gravetter, Larry B. Wallnau
Publisher:
Cengage Learning

Elementary Statistics: Picturing the World (7th E…
Statistics
ISBN:
9780134683416
Author:
Ron Larson, Betsy Farber
Publisher:
PEARSON

The Basic Practice of Statistics
Statistics
ISBN:
9781319042578
Author:
David S. Moore, William I. Notz, Michael A. Fligner
Publisher:
W. H. Freeman

Introduction to the Practice of Statistics
Statistics
ISBN:
9781319013387
Author:
David S. Moore, George P. McCabe, Bruce A. Craig
Publisher:
W. H. Freeman