The mean height of US adults age 20 and older is about 66.5 inches. In our sample data, we have a sample of 38 college students from a single college. The average height of the sample is 68 inches and a standard deviation of 5.33 inches. Let's test if the mean height of students at this college is significantly different than 66.5 inches. Use a level of significance of 5%.
The mean height of US adults age 20 and older is about 66.5 inches. In our sample data, we have a sample of 38 college students from a single college. The average height of the sample is 68 inches and a standard deviation of 5.33 inches. Let's test if the mean height of students at this college is significantly different than 66.5 inches. Use a level of significance of 5%.

Glencoe Algebra 1, Student Edition, 9780079039897, 0079039898, 2018
18th Edition
ISBN:9780079039897
Author:Carter
Publisher:Carter
Chapter10: Statistics
Section10.4: Distributions Of Data
Problem 19PFA

Related questions
Question
2 only use second pic as guidelines
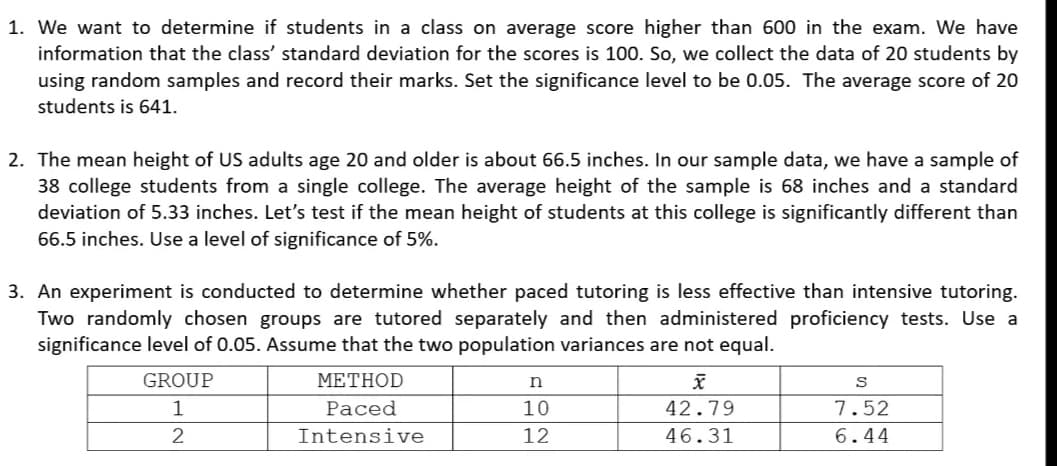
Transcribed Image Text:1. We want to determine if students in a class on average score higher than 600 in the exam. We have
information that the class' standard deviation for the scores is 100. So, we collect the data of 20 students by
using random samples and record their marks. Set the significance level to be 0.05. The average score of 20
students is 641.
2. The mean height of US adults age 20 and older is about 66.5 inches. In our sample data, we have a sample of
38 college students from a single college. The average height of the sample is 68 inches and a standard
deviation of 5.33 inches. Let's test if the mean height of students at this college is significantly different than
66.5 inches. Use a level of significance of 5%.
3. An experiment is conducted to determine whether paced tutoring is less effective than intensive tutoring.
Two randomly chosen groups are tutored separately and then administered proficiency tests. Use a
significance level of 0.05. Assume that the two population variances are not equal.
GROUP
METHOD
1
Paced
10
42.79
7.52
2
Intensive
12
46.31
6.44
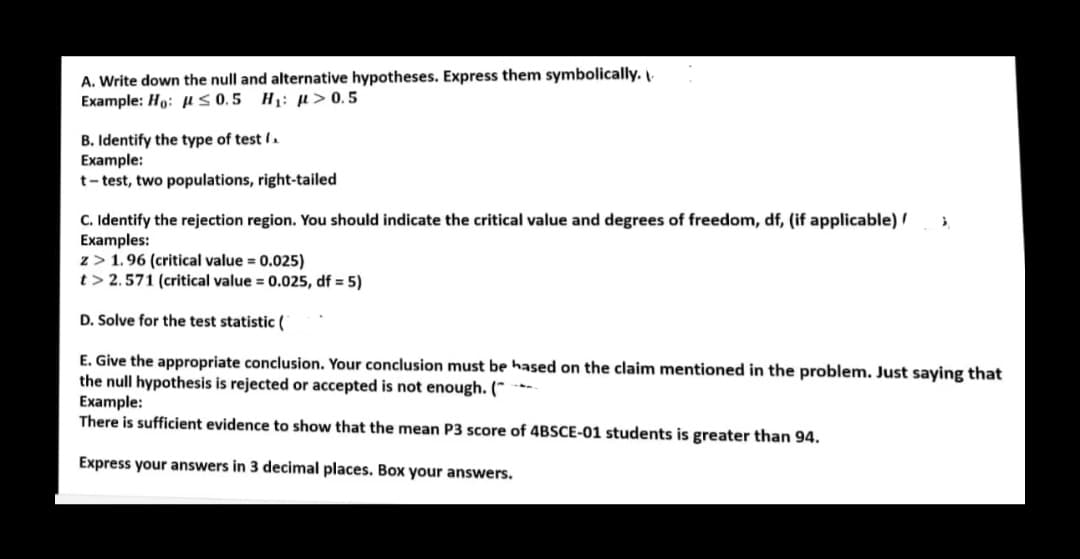
Transcribed Image Text:A. Write down the null and alternative hypotheses. Express them symbolically.
Example: Ho: µs 0.5 H1: µ> 0.5
B. Identify the type of test (.
Example:
t- test, two populations, right-tailed
C. Identify the rejection region. You should indicate the critical value and degrees of freedom, df, (if applicable) I
Examples:
z> 1.96 (critical value = 0.025)
t > 2.571 (critical value = 0.025, df = 5)
D. Solve for the test statistic (
E. Give the appropriate conclusion. Your conclusion must be hased on the claim mentioned in the problem. Just saying that
the null hypothesis is rejected or accepted is not enough. (* *.
Example:
There is sufficient evidence to show that the mean P3 score of 4BSCE-01 students is greater than 94.
Express your answers in 3 decimal places. Box your answers.
Expert Solution
This question has been solved!
Explore an expertly crafted, step-by-step solution for a thorough understanding of key concepts.

This is a popular solution!

Trending now
This is a popular solution!

Step by step
Solved in 2 steps with 3 images

Recommended textbooks for you
Glencoe Algebra 1, Student Edition, 9780079039897…
Algebra
ISBN:
9780079039897
Author:
Carter
Publisher:
McGraw Hill
Glencoe Algebra 1, Student Edition, 9780079039897…
Algebra
ISBN:
9780079039897
Author:
Carter
Publisher:
McGraw Hill