The mean SAT score in mathematics is 585. The standard deviation of these scores is 46. A special preparation course claims that the mean SAT score, u, of its graduates is greater than 585. An independent researcher tests this by taking a random sample of 50 students who completed the course; the mean SAT score in mathematics for the sample was 590. At the 0.05 level of significance, can we conclude that the population mean SAT score for graduates of the course is greater than 585? Assume that the population standard deviation of the scores of course graduates is also 46. Perform a one-tailed test. Then complete the parts below. Carry your intermediate computations to three or more decimal places, and round your responses as specified below. (If necessary, consult a list of formulas.) (a) State the null hypothesis H, and the alternative hypothesis H,. H, :0 H :0 (b) Determine the type of test statistic to use. D=D OSO (Choose one) ▼ (c) Find the value of the test statistic. (Round to three or more decimal places.)
The mean SAT score in mathematics is 585. The standard deviation of these scores is 46. A special preparation course claims that the mean SAT score, u, of its graduates is greater than 585. An independent researcher tests this by taking a random sample of 50 students who completed the course; the mean SAT score in mathematics for the sample was 590. At the 0.05 level of significance, can we conclude that the population mean SAT score for graduates of the course is greater than 585? Assume that the population standard deviation of the scores of course graduates is also 46. Perform a one-tailed test. Then complete the parts below. Carry your intermediate computations to three or more decimal places, and round your responses as specified below. (If necessary, consult a list of formulas.) (a) State the null hypothesis H, and the alternative hypothesis H,. H, :0 H :0 (b) Determine the type of test statistic to use. D=D OSO (Choose one) ▼ (c) Find the value of the test statistic. (Round to three or more decimal places.)

MATLAB: An Introduction with Applications
6th Edition
ISBN:9781119256830
Author:Amos Gilat
Publisher:Amos Gilat
Chapter1: Starting With Matlab
Section: Chapter Questions
Problem 1P

Related questions
Question
part D E
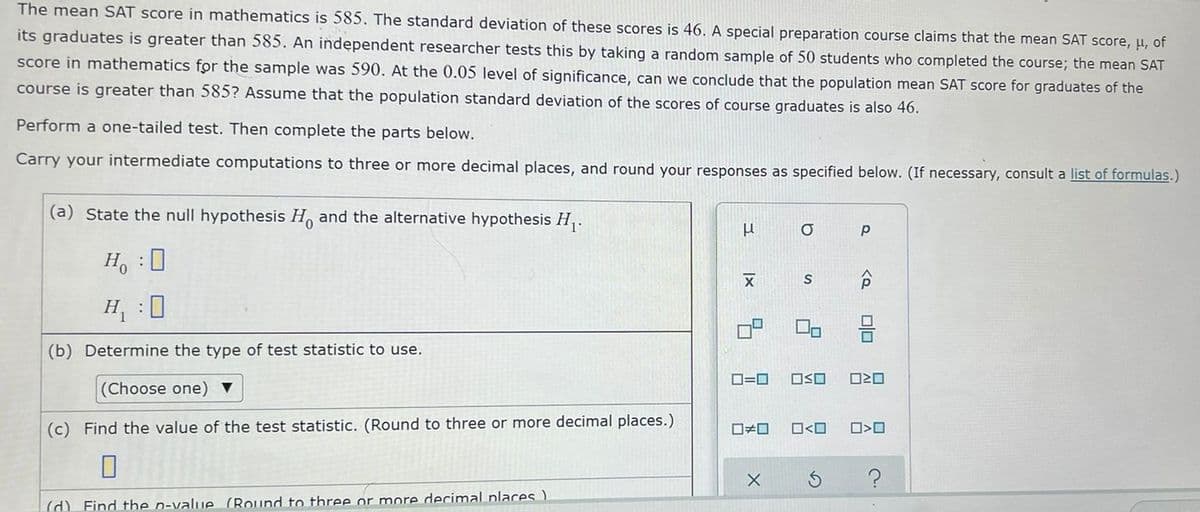
Transcribed Image Text:The mean SAT score in mathematics is 585. The standard deviation of these scores is 46. A special preparation course claims that the mean SAT score, u, of
its graduates is greater than 585. An independent researcher tests this by taking a random sample of 50 students who completed the course; the mean SAT
score in mathematics for the sample was 590. At the 0.05 level of significance, can we conclude that the population mean SAT score for graduates of the
course is greater than 585? Assume that the population standard deviation of the scores of course graduates is also 46.
Perform a one-tailed test. Then complete the parts below.
Carry your intermediate computations to three or more decimal places, and round your responses as specified below. (If necessary, consult a list of formulas.)
(a) State the null hypothesis H, and the alternative hypothesis H,.
H, :0
H, :0
(b) Determine the type of test statistic to use.
D=0
OSO
(Choose one) ▼
(c) Find the value of the test statistic. (Round to three or more decimal places.)
O<O
(d) Find the n-value (Round to three or more decimal places )
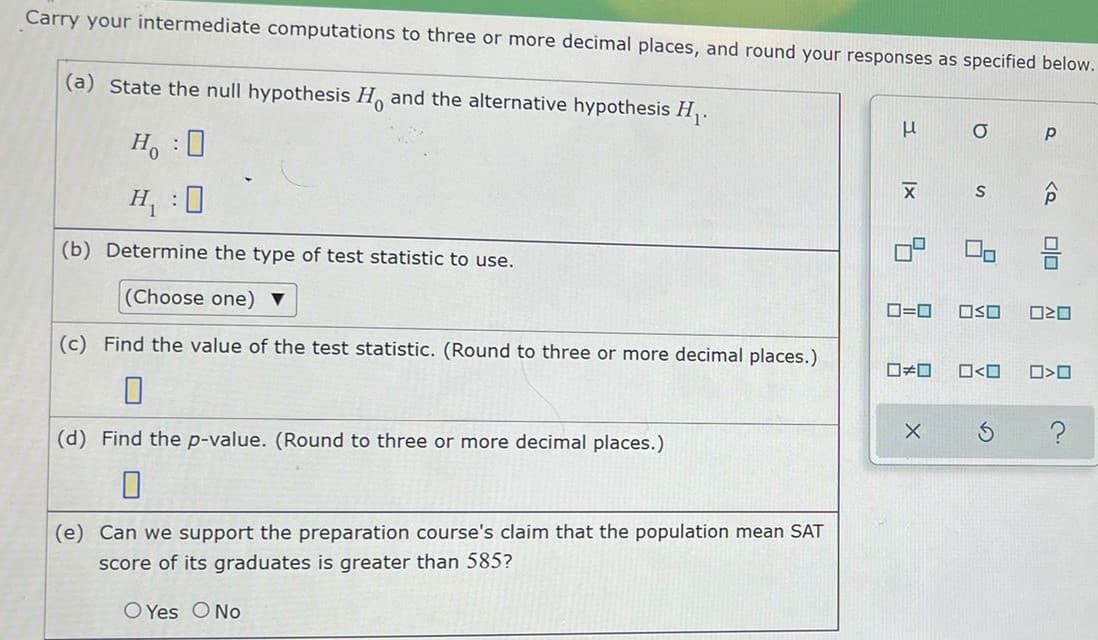
Transcribed Image Text:Carry your intermediate computations to three or more decimal places, and round your responses as specified below.
(a) State the null hypothesis H, and the alternative hypothesis H,.
Ho :0
H
(b) Determine the type of test statistic to use.
ロロ
(Choose one) ▼
ロ=ロ
ロSロ
ロ2ロ
(c) Find the value of the test statistic. (Round to three or more decimal places.)
ロ<ロ
ロ>ロ
(d) Find the p-value. (Round to three or more decimal places.)
(e) Can we support the preparation course's claim that the population mean SAT
score of its graduates is greater than 585?
O Yes O No
nin
の
Expert Solution
This question has been solved!
Explore an expertly crafted, step-by-step solution for a thorough understanding of key concepts.

Step by step
Solved in 3 steps

Recommended textbooks for you
MATLAB: An Introduction with Applications
Statistics
ISBN:
9781119256830
Author:
Amos Gilat
Publisher:
John Wiley & Sons Inc

Probability and Statistics for Engineering and th…
Statistics
ISBN:
9781305251809
Author:
Jay L. Devore
Publisher:
Cengage Learning

Statistics for The Behavioral Sciences (MindTap C…
Statistics
ISBN:
9781305504912
Author:
Frederick J Gravetter, Larry B. Wallnau
Publisher:
Cengage Learning
MATLAB: An Introduction with Applications
Statistics
ISBN:
9781119256830
Author:
Amos Gilat
Publisher:
John Wiley & Sons Inc
Probability and Statistics for Engineering and th…
Statistics
ISBN:
9781305251809
Author:
Jay L. Devore
Publisher:
Cengage Learning
Statistics for The Behavioral Sciences (MindTap C…
Statistics
ISBN:
9781305504912
Author:
Frederick J Gravetter, Larry B. Wallnau
Publisher:
Cengage Learning

Elementary Statistics: Picturing the World (7th E…
Statistics
ISBN:
9780134683416
Author:
Ron Larson, Betsy Farber
Publisher:
PEARSON

The Basic Practice of Statistics
Statistics
ISBN:
9781319042578
Author:
David S. Moore, William I. Notz, Michael A. Fligner
Publisher:
W. H. Freeman

Introduction to the Practice of Statistics
Statistics
ISBN:
9781319013387
Author:
David S. Moore, George P. McCabe, Bruce A. Craig
Publisher:
W. H. Freeman