The mean waiting time at the drive-through of a fast-food restaurant from the time an order is placed to the time the order is received is 87.5 seconds. A manager devises a new drive-through system that she believes will decrease wait time. As a test, she initiates the new system at her restaurant and measures the wait time for 10 randomly selected orders. The wait times are provided in the table to the right. Complete parts (a) and (b) below. 103.2 80.8 66.9 93.3 56.1 86.1 74.4 69.7 64.1 85.4 Click the icon to view the table of correlation coefficient critical values. (a) Because the sample size is small, the manager must verify that the wait time is normally distributed and the sample does not contain any outliers. The normal probability plot is shown below and the sample correlation coefficient is known to be r=0.993. Are the conditions for testing the hypothesis satisfied? satisfied. The normal probability plot the conditions show any outliers. linear enough, since the correlation coefficient is than the critical value. In addition, a boxplot does not A Expected 2-score 2 1. 0- OFFET 1gb hd -1- Time (sec) (b) is the new system effective? Conduct a hypothesis test using the P-value approach and a level of significance of a = 0.05. First determine the appropriate hypotheses. o S
The mean waiting time at the drive-through of a fast-food restaurant from the time an order is placed to the time the order is received is 87.5 seconds. A manager devises a new drive-through system that she believes will decrease wait time. As a test, she initiates the new system at her restaurant and measures the wait time for 10 randomly selected orders. The wait times are provided in the table to the right. Complete parts (a) and (b) below. 103.2 80.8 66.9 93.3 56.1 86.1 74.4 69.7 64.1 85.4 Click the icon to view the table of correlation coefficient critical values. (a) Because the sample size is small, the manager must verify that the wait time is normally distributed and the sample does not contain any outliers. The normal probability plot is shown below and the sample correlation coefficient is known to be r=0.993. Are the conditions for testing the hypothesis satisfied? satisfied. The normal probability plot the conditions show any outliers. linear enough, since the correlation coefficient is than the critical value. In addition, a boxplot does not A Expected 2-score 2 1. 0- OFFET 1gb hd -1- Time (sec) (b) is the new system effective? Conduct a hypothesis test using the P-value approach and a level of significance of a = 0.05. First determine the appropriate hypotheses. o S

Holt Mcdougal Larson Pre-algebra: Student Edition 2012
1st Edition
ISBN:9780547587776
Author:HOLT MCDOUGAL
Publisher:HOLT MCDOUGAL
Chapter11: Data Analysis And Probability
Section: Chapter Questions
Problem 8CR

Related questions
Question
Transcribed Image Text:103.2
80.8
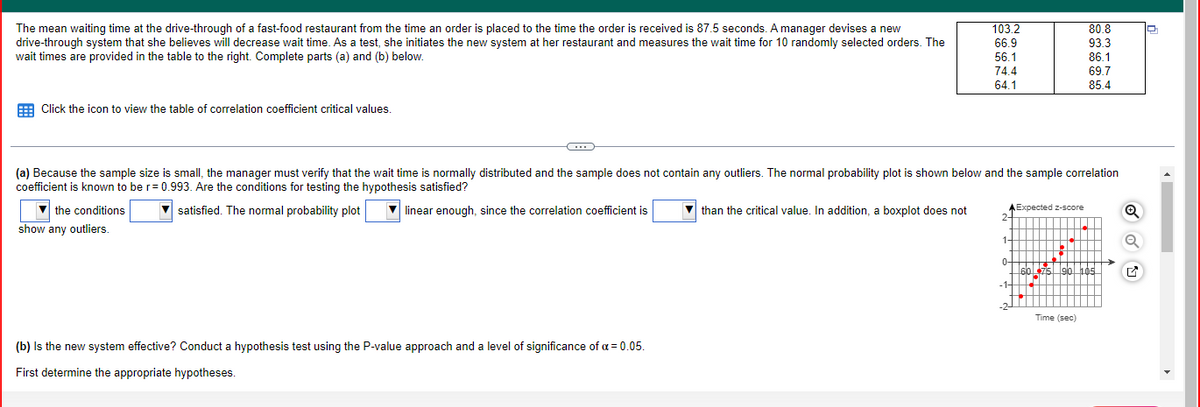
The mean waiting time at the drive-through of a fast-food restaurant from the time an order is placed to the time the order is received is 87.5 seconds. A manager devises a new
drive-through system that she believes will decrease wait time. As a test, she initiates the new system at her restaurant and measures the wait time for 10 randomly selected orders. The
wait times are provided in the table to the right. Complete parts (a) and (b) below.
66.9
93.3
56.1
86.1
74.4
69.7
64.1
85.4
Click the icon to view the table of correlation coefficient critical values.
C
(a) Because the sample size is small, the manager must verify that the wait time is normally distributed and the sample does not contain any outliers. The normal probability plot is shown below and the sample correlation
coefficient is known to be r=0.993. Are the conditions for testing the hypothesis satisfied?
satisfied. The normal probability plot
linear enough, since the correlation coefficient is
than the critical value. In addition, a boxplot does not
the conditions
show any outliers.
AExpected z-score
2-
1.
P
0-
775 lah hỏ:
-1-
(b) Is the new system effective? Conduct a hypothesis test using the P-value approach and a level of significance of α = 0.05.
First determine the appropriate hypotheses.
sh
HTT
Time (sec)
Expert Solution
This question has been solved!
Explore an expertly crafted, step-by-step solution for a thorough understanding of key concepts.

This is a popular solution!

Trending now
This is a popular solution!

Step by step
Solved in 4 steps

Recommended textbooks for you
Holt Mcdougal Larson Pre-algebra: Student Edition…
Algebra
ISBN:
9780547587776
Author:
HOLT MCDOUGAL
Publisher:
HOLT MCDOUGAL

Algebra & Trigonometry with Analytic Geometry
Algebra
ISBN:
9781133382119
Author:
Swokowski
Publisher:
Cengage

Elements Of Modern Algebra
Algebra
ISBN:
9781285463230
Author:
Gilbert, Linda, Jimmie
Publisher:
Cengage Learning,
Holt Mcdougal Larson Pre-algebra: Student Edition…
Algebra
ISBN:
9780547587776
Author:
HOLT MCDOUGAL
Publisher:
HOLT MCDOUGAL
Algebra & Trigonometry with Analytic Geometry
Algebra
ISBN:
9781133382119
Author:
Swokowski
Publisher:
Cengage
Elements Of Modern Algebra
Algebra
ISBN:
9781285463230
Author:
Gilbert, Linda, Jimmie
Publisher:
Cengage Learning,