The mean waiting time at the drive-through of a fast-food restaurant from the time an order is placed to the time the order is received is 83.2 seconds. A manager devises a new drive-through system that she believes will decrease wait time. As a test, she initiates the new system at her restaurant and measures the wait time for 10 randomly selected orders. The wait times are provided in the table to the right. Complete parts (a) and (b) below. 106.3 66.7 58.0 73.8 64.1 80.5 94.8 84.2 69.8 81.8 E Click the icon to view the table of correlation coefficient critical values. (a) Because the sample size is small, the manager must verify that the wait time is normally distributed and the sample does not contain any outliers. The normal probability plot is shown below and the sample correlation coefficient is known ber=0.982. Are the conditions for testing the hypothesis satisfied? the conditions V satisfied. The normal probability plot linear enough, since the correlation coefficient is than the critical value. In addition, a boxplot does not show any outliers. AExpected z-score 2- 1- 0- 00 75 00 105 Time (sec)
The mean waiting time at the drive-through of a fast-food restaurant from the time an order is placed to the time the order is received is 83.2 seconds. A manager devises a new drive-through system that she believes will decrease wait time. As a test, she initiates the new system at her restaurant and measures the wait time for 10 randomly selected orders. The wait times are provided in the table to the right. Complete parts (a) and (b) below. 106.3 66.7 58.0 73.8 64.1 80.5 94.8 84.2 69.8 81.8 E Click the icon to view the table of correlation coefficient critical values. (a) Because the sample size is small, the manager must verify that the wait time is normally distributed and the sample does not contain any outliers. The normal probability plot is shown below and the sample correlation coefficient is known ber=0.982. Are the conditions for testing the hypothesis satisfied? the conditions V satisfied. The normal probability plot linear enough, since the correlation coefficient is than the critical value. In addition, a boxplot does not show any outliers. AExpected z-score 2- 1- 0- 00 75 00 105 Time (sec)

Mathematics For Machine Technology
8th Edition
ISBN:9781337798310
Author:Peterson, John.
Publisher:Peterson, John.
Chapter29: Tolerance, Clearance, And Interference
Section: Chapter Questions
Problem 16A: Spacers are manufactured to the mean dimension and tolerance shown in Figure 29-12. An inspector...

Related questions

Question
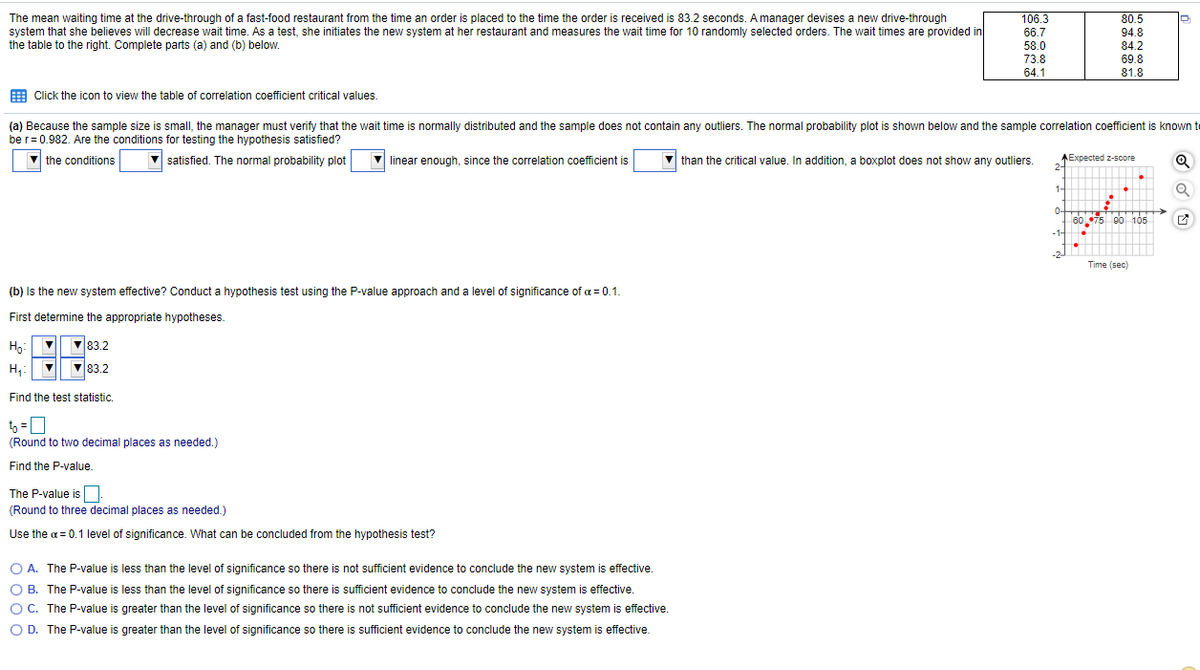
Transcribed Image Text:The mean waiting time at the drive-through of a fast-food restaurant from the time an order is placed to the time the order is received is 83.2 seconds. A manager devises a new drive-through
system that she believes will decrease wait time. As a test, she initiates the new system at her restaurant and measures the wait time for 10 randomly selected orders. The wait times are provided in
the table to the right. Complete parts (a) and (b) below.
106.3
80.5
66.7
94.8
58.0
84.2
73.8
69.8
64.1
81.8
E Click the icon to view the table of correlation coefficient critical values.
(a) Because the sample size is small, the manager must verify that the wait time is normally distributed and the sample does not contain any outliers. The normal probability plot is shown below and the sample correlation coefficient is known to
be r= 0.982. Are the conditions for testing the hypothesis satisfied?
V the conditions
V
|satisfied. The normal probability plot
V linear enough, since the correlation coefficient is
than the critical value. In addition, a boxplot does not show any outliers.
AExpected z-score
1-
0-
---
60 75 90 105
-1-
Time (sec)
(b) Is the new system effective? Conduct a hypothesis test using the P-value approach and a level of significance of a = 0.1.
First determine the appropriate hypotheses.
Ho:
V83.2
H,:
V
83.2
Find the test statistic.
t =0
%3D
(Round to two decimal places as needed.)
Find the P-value.
The P-value is.
(Round to three decimal places as needed.)
Use the a= 0.1 level of significance. What can be concluded from the hypothesis test?
O A. The P-value is less than the level of significance so there is not sufficient evidence to conclude the new system is effective.
O B. The P-value is less than the level of significance so there is sufficient evidence to conclude the new system is effective.
OC. The P-value is greater than the level of significance so there is not sufficient evidence to conclude the new system is effective.
O D. The P-value is greater than the level of significance so there is sufficient evidence to conclude the new system is effective.
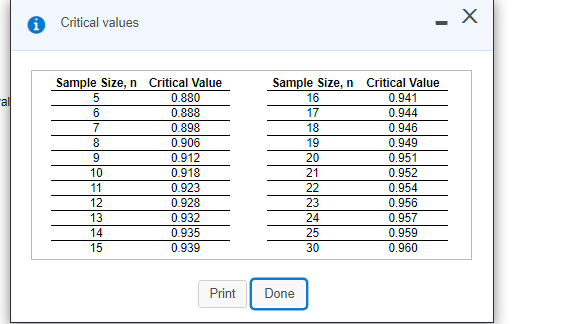
Transcribed Image Text:Critical values
Sample Size, n Critical Value
Sample Size, n Critical Value
0.880
16
0.941
ral
0.888
17
0.944
0.898
18
0.946
0.906
19
0.949
0.912
20
0.951
10
0.918
21
0.952
11
0.923
22
0.954
12
0.928
23
0.956
13
0.932
24
0.957
14
0.935
25
0.959
15
0.939
30
0.960
Print
Done
cola0 234 5
Expert Solution
This question has been solved!
Explore an expertly crafted, step-by-step solution for a thorough understanding of key concepts.

This is a popular solution!

Trending now
This is a popular solution!

Step by step
Solved in 4 steps with 2 images

Knowledge Booster


Learn more about
Need a deep-dive on the concept behind this application? Look no further. Learn more about this topic, statistics and related others by exploring similar questions and additional content below.Recommended textbooks for you
Mathematics For Machine Technology
Advanced Math
ISBN:
9781337798310
Author:
Peterson, John.
Publisher:
Cengage Learning,

Holt Mcdougal Larson Pre-algebra: Student Edition…
Algebra
ISBN:
9780547587776
Author:
HOLT MCDOUGAL
Publisher:
HOLT MCDOUGAL

Glencoe Algebra 1, Student Edition, 9780079039897…
Algebra
ISBN:
9780079039897
Author:
Carter
Publisher:
McGraw Hill
Mathematics For Machine Technology
Advanced Math
ISBN:
9781337798310
Author:
Peterson, John.
Publisher:
Cengage Learning,
Holt Mcdougal Larson Pre-algebra: Student Edition…
Algebra
ISBN:
9780547587776
Author:
HOLT MCDOUGAL
Publisher:
HOLT MCDOUGAL
Glencoe Algebra 1, Student Edition, 9780079039897…
Algebra
ISBN:
9780079039897
Author:
Carter
Publisher:
McGraw Hill