The means and standard deviations are given in the data table. With a correlation of 0.826, calculate the slope and explain what the slope tell you in the context of this problem. Calculate the intercept and explain what the intercept tell you in the context of this problem. For the individual with dose = 2.02, what is the predicted AZT concentration and what is the residual?
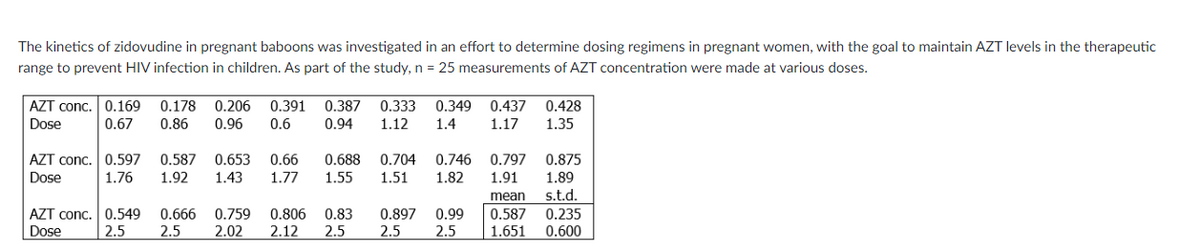
Q: Use the following scenario to determine whether the statement is true or false. Scenario: Storm data…
A: Given: First quartile Q1 = 6 Third quartile Q3 = 12.25
Q: Determine whether the follow descriptions correspond to an observational study or an experiment.…
A: Given that (a) Studying how patients respond when given a placebo. (b) A new antibiotic is tested…
Q: Find the height of the density curve. Show your work!! What percent of values are greater than 0.9?…
A: It is given that K is equally likely to take any value between a = 0.4 and b = 1.2 i.e K follows…
Q: K- Assume that the sample is a simple random sample obtained from a normally distributed population…
A: It is given that Level of confidence = 99% Margin of error = 1%
Q: ata was collected on 500 high school students to help determine which factors are associated with…
A: Quantitative data: Quantitative data is the value of data in the form of counts or numbers. Here…
Q: 6. (L&K 4.24) In problem 5, test the null hypothesis Ho = 6 at significance level a = 0.05.
A: Given: n = 10 α = 0.05 Formula Used: Test-statistic t = X-μs2n
Q: The Mathematics section of the ACT test had a mean of 20.9 and an SD of 5.3 for the years 2013-2015.…
A:
Q: 60 randomly selected students were asked the number of pairs of shoes they have. Let X represent the…
A:
Q: Suppose that Y₁, Y₂,..., Y is a random sample of size m from Gamma (a = 3,ß= 0), where 8 is not…
A:
Q: Create a tree-node chart and find what are the chances of pulling at least one green card.
A: Given: Total cards are 8. There are 5 green and 3 yellow cards.
Q: A publisher of magazines for teenager's wishes to determine whether there is a relationship between…
A: Given that Type of Magazine Total Gender Music Clothes Gadgets Male 29 32 59…
Q: 38. The life, in years, of a certain type of electrical switch has an exponential distribution with…
A:
Q: 12 13 14 15 16 17 18 AnswerHow to enter your answer (opens in new window) 2 Points…
A: Given that Stem and leaf plot 155 written in Stem and leaf plot as Stem | Leaf 15 | 5
Q: Here is a sample data set. 377.8 412.2 453 448.6 373.8 375.7 409.2 359.3 414.5 449.5 447.2 386.1…
A: From the provided information, Number of observations (n) = 54 Arranging the data values into…
Q: a. Find the mean, μ = b. Find the standard deviation, σ =
A: Given: A train arrives every eight minutes. The length of time follows uniform distribution.
Q: what is The first quartile is: The third quartile is: What percent of the respondents have at…
A: Given: Total number of students=60
Q: Ridge and Lasso regression are two methods for estimating the parameter vector of a linear…
A: In Ridge and Lasso Regression, we have a penalty parameter also known as Tuning parameter λ whose…
Q: values. Use ascending order of the sample medians. Sample Median Probability ▼ ▼ 7 1 ☐ ▼ 7 (Type…
A: Given: Population is 48,52,54 and 57 Sample of size two are choosen.
Q: The purpose of this assignment is to learn to compute key numerical measures for descriptive…
A: Given: n = 20 Formula Used: Mean X = ∑Xin Median = 2(n+1)4thterm Firt quartile Q1 = n+14thterm Third…
Q: How can I map this question in SPSS ?
A: From the given information, the frequencies are 6, 14, 9 and 7. The proportions are 0.30, 0.25, 0.25…
Q: Suppose 2% of cotton fabric rolls and 3% of nylon fabric rolls contain flaws. Of the rolls used by a…
A: Given that P(C ) =0.70,P(N) =0.30 P(F/C) =0.02,P(F/N) =0.03 P( no flaws ) =?
Q: For the following data, find mode and range 13,42,34,65,34,87,56,43,63,45
A: Answer: Given data is, 13,42,34,65,34,87,56,43,63,45 Data in ascending order:…
Q: If 2 specific persons among the 10 people lined up to get on the bus refuse on following each other…
A:
Q: Check here for instructional material to complete this problem. 2 (n-1)s² 0² Evaluate the formula x²…
A: given data σ=3.36n=36s=3.65find value of χ2= (n-1)s2σ2
Q: (a) What is the probability that on a randomly selected day, the flight will depart after 9:11 a.m.?…
A: Given: μ=7σ=4
Q: C={4,5,6,7} I don't see this set on your sheet under "now"
A: We have given that Universal set S = {0,1,2,3,4,5,6,7,8,9} A = {0,2,4,6,8}, B={1,3,5,7,9},…
Q: of people have type O or Rh- factor. Round all decimals to 4 places where possible. (a) Find the…
A: Given that P(Type O) = 38% = 0.38 P(Rh-Factor) = 10% = 0.10 P(Type O or Rh-factor) = 46% = 0.46
Q: A student selects 49 batteries from a population with a mean mass value of 72: (uts). She measured a…
A: Given Information: Sample size n=49 Sample mean x¯=74 Standard deviation σ=s=7 Hypothesized value of…
Q: Hey, need help with this question! Consists of three parts: 1) Find the number of plants that were…
A:
Q: Find the odds for drawing a club from a standard 52 card deck
A: given data odds of drawing a club from a standard deck = ?
Q: True or False: If you are asked to describe the type of data represented by distances from gas…
A: Given that The type of data represented by distances from gas stations to your home
Q: I regress Y on X and get the following information. Standard errors are in parentheses. Calculate…
A: The objective is to find the t-statistic on the y-intercept and on the coefficient.
Q: Let X be a random variable which represents the lifetime in years of a particular battery. We are…
A: Since you have posted a question with multiple subparts, we will solve first 3 sub-parts for you. To…
Q: Find the 44th percentile, P44, from the following data 2 5 6 7 8 9 13 15 21 22 25 28 31 32 35 49 53…
A: here given data are :- 2,5,6,7,8, 9,13,15,21,22, 25,28,31,32,35, 49,53,54,56,57, 58,59,62,64,69,…
Q: Suppose that shoe sizes of American women have a bell-shaped distribution with a mean of 8.338.33…
A: Given: Mean, μ = 8.33 Std deviation, σ = 1.48
Q: Show that the characteristic function of a Gaussian random variable with zero mean and variance o2…
A:
Q: ABC media company published 4 magazines for the teenage market. The executive editor of the company…
A: Given that: Magazine preference Gender Beat Youth Grow Line Column Total Girls 18 12 20 18…
Q: Despite all efforts by the quality control department, the fabric made at benton corporation always…
A: Given an average of 0.51 defects per 500 yardsλ=0.51 per yardsLet "x" be no.of defects in a given…
Q: 1. You have the following PDF: f(x) = {1/9 1 ≤ x ≤ 10} (e) Calculate P(2 < X < 5). (f) Calculate P(X…
A: Given;PDF of X is :f(x)=19 ; 1≤x≤10
Q: The table below gives the list price and the number of bids received for five randomly selected…
A:
Q: TA file 6 6 8 7 3 3 8 7 5 9 4 3 8 4 4 5 6 5 9 995 9 7 8 3 10 8 9 velop a 95% confidence interval…
A: There are 50 observations; n=50 6 4 6 8 7 7 6 3 3 8 10 4 8 7 8 7 5 9 5 8 4 3 8 5 5 4 4 4 8 4…
Q: answer d
A: From the above parts we have µx̅ = 155σx̅ = 6.75
Q: Table 2.30 Frequency Distribution of Family Incomes 2.29 Family Income, S 10,000-11,999…
A: We have to make the following table to compute mean, median and mode Class Frequency (f) Mid…
Q: K The data given to the right includes data from 43 candies, and 7 of them are red. The company that…
A: It is given that Sample size n = 43 Number of red candies X = 7 Confidence level = 90%
Q: Q2// On a certain day an executive received fifteen telephone calls. The distribution of the time…
A: Solution: Let X represent the time spent on a call (in minutes)
Q: True or False: The slope of a linear prediction equation tells you whether the association is…
A: Here we have to identify whether the given statement is True or False The slope of a linear equation…
Q: A students ID number is a/an ____ variable? A. Ordinal B. Nominal C. Continuous D. Discrete
A: The given statement is 'The variable student ID number'.
Q: find the five number summary for the data by hand.
A: It is given that the stem and leaf plot of the data. Here, need to find out the five number summary…
Q: a. Use the summation operator (Σ) to simplify the following expressions (where X and Y are…
A:
Q: Customers waiting at Ellerton Bank have been complaining about the amount of time they must wait in…
A: The given data set is, 21, 14, 14, 14, 19, 16, 16, 11, 16 The number of observations in the data set…
Trending now
This is a popular solution!
Step by step
Solved in 5 steps
- Table 6 shows the population, in thousands, of harbor seals in the Wadden Sea over the years 1997 to 2012. a. Let x represent time in years starting with x=0 for the year 1997. Let y represent the number of seals in thousands. Use logistic regression to fit a model to these data. b. Use the model to predict the seal population for the year 2020. c. To the nearest whole number, what is the limiting value of this model?Repeat Example 5 when microphone A receives the sound 4 seconds before microphone B.Researchers interested in lead exposure due to car exhaust sampled the blood of 52 police officers subjected to constant inhalation of automobile exhaust fumes while working traffic enforcement in a primarily urban environment. The blood samples of these officers had an average lead concentration of 124.32 µg/l and a SD of 37.74 µg/l; a previous study of individuals from a nearby suburb, with no history of exposure, found an average blood level concentration of 35 µg/l. Based on your preceding result, without performing a calculation, would a 99% confidence interval for the average blood concentration level of police officers contain 35 µg/l? Based on your preceding result, without performing a calculation, would a 99% confidence interval for this difference contain 0? Explain why or why not.
- A researcher hypothesizes that in a certain country the net annual growth of private sector purchases of government bonds, B, is positively related to the nominal rate of interest on the bonds, NI, and negatively related to the rate of inflation Π: Bt = a0 + a1NIt + a2Π t + ut Note that it may be hypothesized that B depends on the real rate of interest on bonds, R, where R = NI – Π. Using a sample of 56 annual observations, s/he estimates the following equations: (1) Bt = 0.43 + 0.90NIt - 0.97Πt R21 = 0.962, SSR1 = 2.20, QRESET(F1,52) = 16.6 (3.58) (8.80) (-1.05) (2) Bt = 0.44 + 0.94Rt R22 = 0.960, SSR2 = 2.22, QRESET(F1,53) = 0.9 (9.70) (16.7) (3) Bt = 0.44 + 1.14NIt SSR3 = 9.20, QRESET(F1,53) = 59.9 (8.84) (36.1) (4) NIt = 0.08 + 0.94Πt R24 = 0.997, SSR4 = 0.18, QRESET(F1,53) = 1.4…The analysis of tooth shrinkage by C. Loring Brace and colleagues at the University of Michigan’s Museum of Anthropology indicates that human tooth size is con-tinuing to decrease and that the evolutionary process has not yet come to a halt. In northern Europeans, for example, tooth size reduction now has a rate of 1% per 1000 years. a. If t represents time in years and y represents tooth size, use the condition that y = 0.99y0 when t = 1000 to find the value of k in the equation y = y0 ekt. Then use this value of k to answer the following questions. b. In about how many years will human teeth be 90% of their present size? c. What will be our descendants’ tooth size 20,000 years from now (as a percentage of our present tooth size)?Researchers interested in lead exposure due to car exhaust sampled the blood of 52 police officers subjected to constant inhalation of automobile exhaust fumes while working traffic enforcement in a primarily urban environment. The blood samples of these officers had an average lead concentration of 124.32 µg/l and a SD of 37.74 µg/l; a previous study of individuals from a nearby suburb, with no history of exposure, found an average blood level concentration of 35 µg/l. Test the hypothesis that the downtown police officers have a higher lead exposure than the group in the previous study. Interpret your results in context. Based on your preceding result, without performing a calculation, would a 99% confidence interval for the average blood concentration level of police officers contain 35 µg/l? Based on your preceding result, without performing a calculation, would a 99% confidence interval for this difference contain 0? Explain why or why not.
- Infants, even newborns, prefer to look at attractive faces compared to less attractive faces (Slater, et al., 1998). In the study, infants from 1 to 6 days old were shown two photographs of women’s faces. Previously, a group of adults had rated one of the faces as significantly more attractive than the other. The babies were positioned in front of a screen on which the photographs were presented. The pair of faces remained on the screen until the baby accumulated a total of 20 seconds of looking at one or the other. The number of seconds looking at the attractive face was recorded for each infant. Suppose that the study used a sample of n = 9 infants and the data produced an average of M = 13 for the attractive face with an estimated standard error sM= 1 (SS = 72). If there were no preference, the 20 seconds should be divided equally between the two photographs. Note that all the available information comes from the sample. Specifically, we do not know the population mean or the…Infants, even newborns, prefer to look at attractive faces compared to less attractive faces (Slater, et al., 1998). In the study, infants from 1 to 6 days old were shown two photographs of women’s faces. Previously, a group of adults had rated one of the faces as significantly more attractive than the other. The babies were positioned in front of a screen on which the photographs were presented. The pair of faces remained on the screen until the baby accumulated a total of 20 seconds of looking at one or the other. The number of seconds looking at the attractive face was recorded for each infant. Suppose that the study used a sample of n = 9 infants and the data produced an average of M = 13 for the attractive face with an estimated standard error sM= 1 (SS = 72). If there were no preference, the 20 seconds should be divided equally between the two photographs. Note that all the available information comes from the sample. Specifically, we do not know the population mean or the…You are interested in determining which of two brands of light bulbs, brand A and brand B, lasts longer under differing conditions of use. Fifty Bovano lamps are fitted with brand A light bulbs, and 50 Bulbrite lamps are fitted with brand B light bulbs. Each light bulb is left on for 20,000 hours straight. Light bulb life is then measured for each bulb, and the average light bulb life for the two brands is compared. What is wrong with this experimental design? Nothing is wrong with this design. The type of lamp is a confounding variable. Not enough light bulbs of each type are used in the study. The experiment should have been conducted on more than two brands of lamps.
- To see the effect of a relatively small error in the estimate of the amount of carbon-14 in a sample being dated, consider this hypothetical situation: a. A bone fragment found in central Illinois in the year 2000 contains 17% of its original carbon-14 content. Estimate the year the animal died. b. Repeat part (a), assuming 18% instead of 17%. c. Repeat part (a), assuming 16% instead of 17.1)A new starch polymer foam with high shock absorbent properties is expected to perform better thanthe old foam which can withstand a maximum impact of 1.56 Joule (J). A simple destructive testto quantify shock absorption ability of the new foam is conducted. Table 5 shows the impact energyabsorbed (in J) that the new foam can withstand for each test. Table 51.61 1.5 1.65 1.7 1.4 1.59 1.65 1.5 Does the recorded data suggests that the new foam performs better than the old foam? Use 2.5%level of significance. 2) A number of 28 university students who smokes completed a questionnaire inquiring their smokinghistory and behavior. The result shows that the average smoking initiation age of this group is 21.6years with a variance of 18.49. Based on past record, the smoking initiation age of universitystudent has a mean of 20.74 years with a standard deviation of 5.1 years. Conduct a necessaryanalysis to determine if the smoking initiation age remain the same as the previous record.…For some genetic mutations, it is thought that the frequency of the mutant gene in men increases linearly with age. If m1 is the frequency at age t1, and m2 is the frequency at age t2, then the yearly rate of increase is estimated by r = (m2 − m1)/(t2 − t1). In a polymerase chain reaction assay, the frequency in 20-year-old men was estimated to be 17.7 ± 1.7 per μgDNA, and the frequency in 40-year-old men was estimated to be 35.9 ± 5.8 per μg DNA. Assume that age is measured with negligible uncertainty.a) Estimate the yearly rate of increase, and find the uncertainty in the estimate.b) Find the relative uncertainty in the estimated rate of increase.