The melting point of various ratios of mixtures of urea and acetaminophen) were determined and the Results are shown below in Table 1. Plot a graph of the data. Table 1: Effect on mp of mixing two compounds Urea 100% 80% 60% 40% 20% 0% Acetaminophen 0% 20% 40% 60% 80% 100% mp 131-133 120-122 110-112 130-132 148-150 169=171 Your task: 1) Plot a graph of the data (mp vs % Acetaminophen) from Table 1.
The melting point of various ratios of mixtures of urea and acetaminophen) were determined and the Results are shown below in Table 1. Plot a graph of the data. Table 1: Effect on mp of mixing two compounds Urea 100% 80% 60% 40% 20% 0% Acetaminophen 0% 20% 40% 60% 80% 100% mp 131-133 120-122 110-112 130-132 148-150 169=171 Your task: 1) Plot a graph of the data (mp vs % Acetaminophen) from Table 1.

Chapter14: Chromatography
Section: Chapter Questions
Problem 9P

Related questions
Question
Can anyone help? I'm not sure what I'm doing wrong but the graph I keep plotting just seems to end up as straight line.
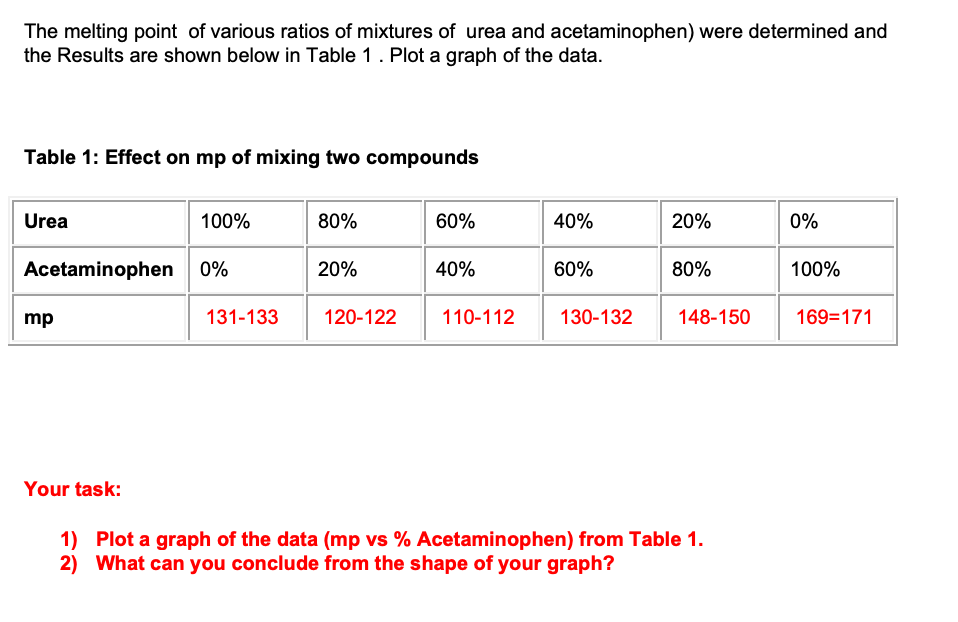
Transcribed Image Text:The melting point of various ratios of mixtures of urea and acetaminophen) were determined and
the Results are shown below in Table 1. Plot a graph of the data.
Table 1: Effect on mp of mixing two compounds
Urea
100%
80%
60%
40%
20%
0%
Acetaminophen 0%
20%
40%
60%
80%
100%
131-133
120-122
110-112
mp
130-132 148-150
169=171
Your task:
1) Plot a graph of the data (mp vs % Acetaminophen) from Table 1.
2) What can you conclude from the shape of your graph?
Expert Solution
This question has been solved!
Explore an expertly crafted, step-by-step solution for a thorough understanding of key concepts.

This is a popular solution!

Trending now
This is a popular solution!

Step by step
Solved in 4 steps with 1 images

Knowledge Booster


Learn more about
Need a deep-dive on the concept behind this application? Look no further. Learn more about this topic, chemistry and related others by exploring similar questions and additional content below.Recommended textbooks for you