The method of tree ring dating gave the following years A.D. for an archaeological excavation site. Assume that the population of x values has an approximately normal distribution. 1229 1285 1299 1320 1268 1316 1275 1317 1275 (a) Use a calculator with mean and standard deviation keys to find the sample mean year x and sample standard deviation s. (Round your answers to the nearest whole number.) A.D. yr (b) Find a 90% confidence interval for the mean of all tree ring dates from this archaeological site. (Round your answers to the nearest whole number.) lower limit A.D. upper limit A.D.
The method of tree ring dating gave the following years A.D. for an archaeological excavation site. Assume that the population of x values has an approximately normal distribution. 1229 1285 1299 1320 1268 1316 1275 1317 1275 (a) Use a calculator with mean and standard deviation keys to find the sample mean year x and sample standard deviation s. (Round your answers to the nearest whole number.) A.D. yr (b) Find a 90% confidence interval for the mean of all tree ring dates from this archaeological site. (Round your answers to the nearest whole number.) lower limit A.D. upper limit A.D.

MATLAB: An Introduction with Applications
6th Edition
ISBN:9781119256830
Author:Amos Gilat
Publisher:Amos Gilat
Chapter1: Starting With Matlab
Section: Chapter Questions
Problem 1P

Related questions

Question
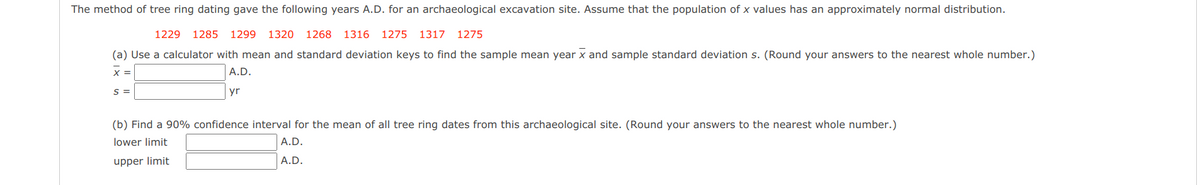
Transcribed Image Text:The method of tree ring dating gave the following years A.D. for an archaeological excavation site. Assume that the population of x values has an approximately normal distribution.
1229
1285 1299
1320 1268 1316
1275
1317 1275
(a) Use a calculator with mean and standard deviation keys to find the sample mean year x and sample standard deviation s. (Round your answers to the nearest whole number.)
A.D.
S =
yr
(b) Find a 90% confidence interval for the mean of all tree ring dates from this archaeological site. (Round your answers to the nearest whole number.)
lower limit
A.D.
upper limit
A.D.
Expert Solution
Step 1
The sample size is . The provided sample data along with the data required to compute the sample mean and sample variance are shown in the table below:
| x | x2 | |
| 1229 | 1510441 | |
| 1285 | 1651225 | |
| 1299 | 1687401 | |
| 1320 | 1742400 | |
| 1268 | 1607824 | |
| 1316 | 1731856 | |
| 1275 | 1625625 | |
| 1317 | 1734489 | |
| 1275 | 1625625 | |
| Sum = | 11584 | 14916886 |

Trending now
This is a popular solution!

Step by step
Solved in 2 steps

Knowledge Booster


Learn more about
Need a deep-dive on the concept behind this application? Look no further. Learn more about this topic, statistics and related others by exploring similar questions and additional content below.Recommended textbooks for you
MATLAB: An Introduction with Applications
Statistics
ISBN:
9781119256830
Author:
Amos Gilat
Publisher:
John Wiley & Sons Inc

Probability and Statistics for Engineering and th…
Statistics
ISBN:
9781305251809
Author:
Jay L. Devore
Publisher:
Cengage Learning

Statistics for The Behavioral Sciences (MindTap C…
Statistics
ISBN:
9781305504912
Author:
Frederick J Gravetter, Larry B. Wallnau
Publisher:
Cengage Learning
MATLAB: An Introduction with Applications
Statistics
ISBN:
9781119256830
Author:
Amos Gilat
Publisher:
John Wiley & Sons Inc
Probability and Statistics for Engineering and th…
Statistics
ISBN:
9781305251809
Author:
Jay L. Devore
Publisher:
Cengage Learning
Statistics for The Behavioral Sciences (MindTap C…
Statistics
ISBN:
9781305504912
Author:
Frederick J Gravetter, Larry B. Wallnau
Publisher:
Cengage Learning

Elementary Statistics: Picturing the World (7th E…
Statistics
ISBN:
9780134683416
Author:
Ron Larson, Betsy Farber
Publisher:
PEARSON

The Basic Practice of Statistics
Statistics
ISBN:
9781319042578
Author:
David S. Moore, William I. Notz, Michael A. Fligner
Publisher:
W. H. Freeman

Introduction to the Practice of Statistics
Statistics
ISBN:
9781319013387
Author:
David S. Moore, George P. McCabe, Bruce A. Craig
Publisher:
W. H. Freeman