
Principles of Economics 2e
2nd Edition
ISBN:9781947172364
Author:Steven A. Greenlaw; David Shapiro
Publisher:Steven A. Greenlaw; David Shapiro
Chapter5: Elasticity
Section: Chapter Questions
Problem 40P: Assume that the supply of law-skilled worker is fairly elastic, but the employers demand for such...

Related questions
Question
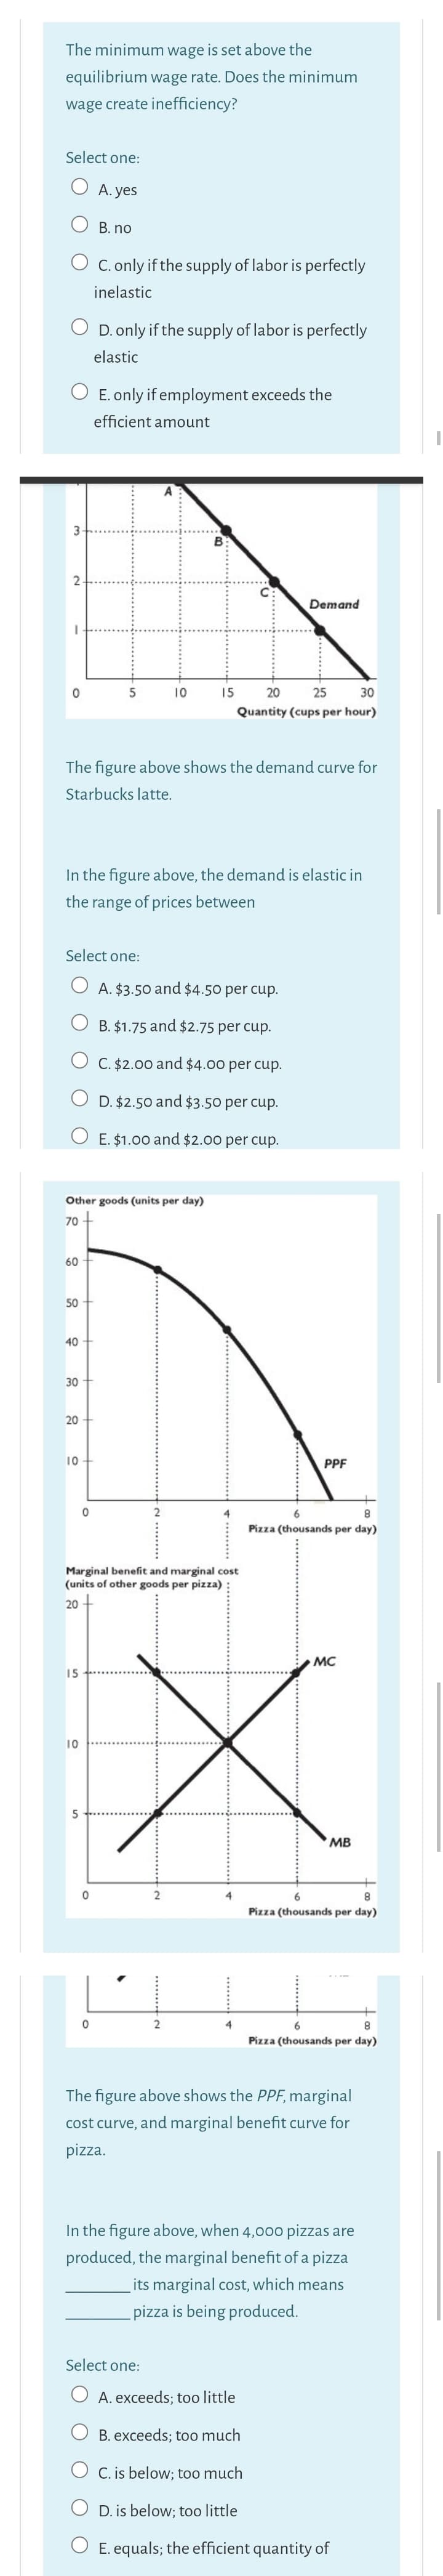
Transcribed Image Text:The minimum wage is set above the
equilibrium wage rate. Does the minimum
wage create inefficiency?
Select one:
A. yes
B. no
C. only if the supply of labor is perfectly
inelastic
O D. only if the supply of labor is perfectly
elastic
O E. only if employment exceeds the
efficient amount
Demand
5
10
15
20
25
30
Quantity (cups per hour)
The figure above shows the demand curve for
Starbucks latte.
In the figure above, the demand is elastic in
the range of prices between
Select one:
O A. $3.50 and $4.50 per cup.
B. $1.75 and $2.75 per cup.
C. $2.00 and $4.00 per cup.
D. $2.50 and $3.50 per cup.
O E. $1.00 and $2.00 per cup.
Other goods (units per day)
70
60
50
40
30
20
10
PPF
Pizza (thousands per day)
Marginal benefit and marginal cost
(units of other goods per pizza)
20
MC
15
10
MB
4
8
Pizza (thousands per day)
2
4
6.
Pizza (thousands per day)
The figure above shows the PPF, marginal
cost curve, and marginal benefit curve for
pizza.
In the figure above, when 4,00o pizzas are
produced, the marginal benefit of a pizza
its marginal cost, which means
pizza is being produced.
Select one:
A. exceeds; too little
B. exceeds; too much
O C. is below; too much
D. is below; too little
E. equals; the efficient quantity of
......
......
Expert Solution
This question has been solved!
Explore an expertly crafted, step-by-step solution for a thorough understanding of key concepts.

This is a popular solution!

Trending now
This is a popular solution!

Step by step
Solved in 2 steps

Knowledge Booster


Learn more about
Need a deep-dive on the concept behind this application? Look no further. Learn more about this topic, economics and related others by exploring similar questions and additional content below.Recommended textbooks for you
Principles of Economics 2e
Economics
ISBN:
9781947172364
Author:
Steven A. Greenlaw; David Shapiro
Publisher:
OpenStax


Economics (MindTap Course List)
Economics
ISBN:
9781337617383
Author:
Roger A. Arnold
Publisher:
Cengage Learning
Principles of Economics 2e
Economics
ISBN:
9781947172364
Author:
Steven A. Greenlaw; David Shapiro
Publisher:
OpenStax
Economics (MindTap Course List)
Economics
ISBN:
9781337617383
Author:
Roger A. Arnold
Publisher:
Cengage Learning