● The minimum weight loss The maximum weight loss The estimated average weight loss

Glencoe Algebra 1, Student Edition, 9780079039897, 0079039898, 2018
18th Edition
ISBN:9780079039897
Author:Carter
Publisher:Carter
Chapter10: Statistics
Section: Chapter Questions
Problem 6SGR

Related questions
Question
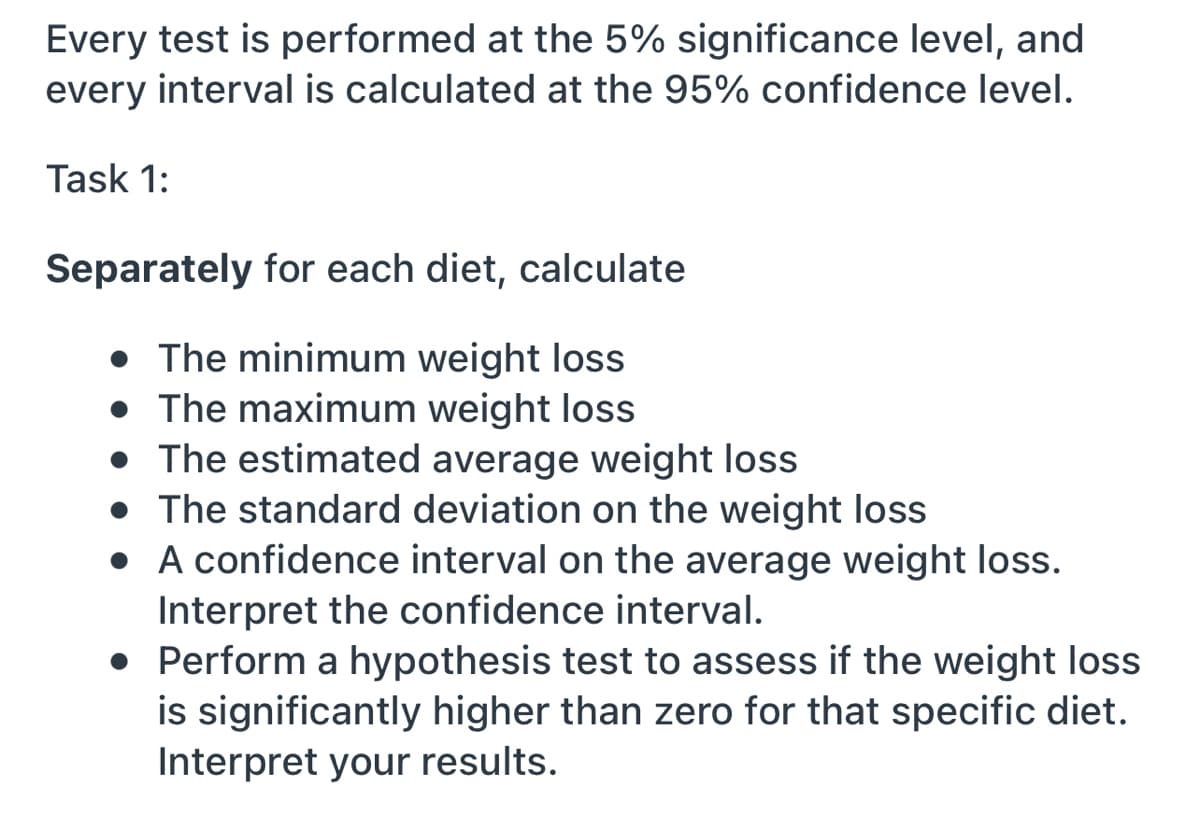
Transcribed Image Text:Every test is performed at the 5% significance level, and
every interval is calculated at the 95% confidence level.
Task 1:
Separately for each diet, calculate
• The minimum weight loss
• The maximum weight loss
• The estimated average weight loss
• The standard deviation on the weight loss
• A confidence interval on the average weight loss.
Interpret the confidence interval.
• Perform a hypothesis test to assess if the weight loss
is significantly higher than zero for that specific diet.
Interpret your results.
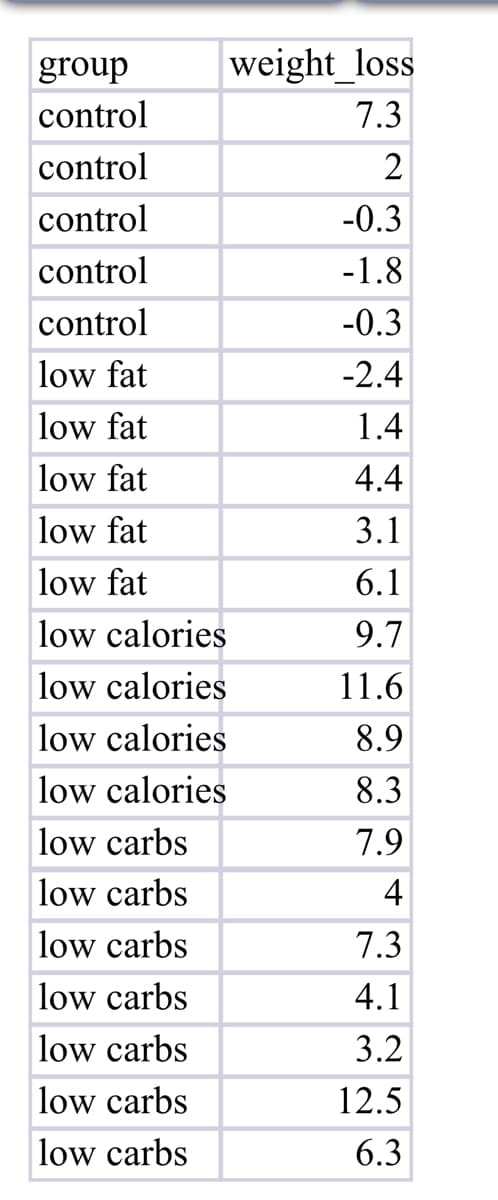
Transcribed Image Text:weight_loss
7.3
group
control
control
control
control
control
low fat
low fat
low fat
low fat
low fat
low calories
low calories
low calories
low calories
low carbs
low carbs
low carbs
low carbs
low carbs
low carbs
low carbs
2
-0.3
-1.8
-0.3
-2.4
1.4
4.4
3.1
6.1
9.7
11.6
8.9
8.3
7.9
4
7.3
4.1
3.2
12.5
6.3
Expert Solution
This question has been solved!
Explore an expertly crafted, step-by-step solution for a thorough understanding of key concepts.

Step by step
Solved in 2 steps

Recommended textbooks for you
Glencoe Algebra 1, Student Edition, 9780079039897…
Algebra
ISBN:
9780079039897
Author:
Carter
Publisher:
McGraw Hill

Holt Mcdougal Larson Pre-algebra: Student Edition…
Algebra
ISBN:
9780547587776
Author:
HOLT MCDOUGAL
Publisher:
HOLT MCDOUGAL

Glencoe Algebra 1, Student Edition, 9780079039897…
Algebra
ISBN:
9780079039897
Author:
Carter
Publisher:
McGraw Hill
Holt Mcdougal Larson Pre-algebra: Student Edition…
Algebra
ISBN:
9780547587776
Author:
HOLT MCDOUGAL
Publisher:
HOLT MCDOUGAL