The Minitab output shown below was obtained by using paired data consisting of weights (in lb) of 32 cars and their highway fuel consumption amounts (in mi/gal). Along with the paired sample data, Minitab was also given a car weight of 5000 lb to be used for predicting the highway fuel consumption amount. Use the information provided in the display to determine the value of the linear correlation coefficient. (Be careful to correctly identify the sign of the correlation coefficient.) Given that there are 32 pairs of data, is there sufficient evidence to support a claim of linear correlation between the weights of cars and their highway fuel consumption amounts? View the Minitab display. ( Minitab output attached)
The Minitab output shown below was obtained by using paired data consisting of weights (in lb) of 32 cars and their highway fuel consumption amounts (in mi/gal). Along with the paired sample data, Minitab was also given a car weight of 5000 lb to be used for predicting the highway fuel consumption amount. Use the information provided in the display to determine the value of the linear correlation coefficient. (Be careful to correctly identify the sign of the correlation coefficient.) Given that there are 32 pairs of data, is there sufficient evidence to support a claim of linear correlation between the weights of cars and their highway fuel consumption amounts? View the Minitab display. ( Minitab output attached)

Glencoe Algebra 1, Student Edition, 9780079039897, 0079039898, 2018
18th Edition
ISBN:9780079039897
Author:Carter
Publisher:Carter
Chapter4: Equations Of Linear Functions
Section4.6: Regression And Median-fit Lines
Problem 17HP

Related questions
Question
Question #13
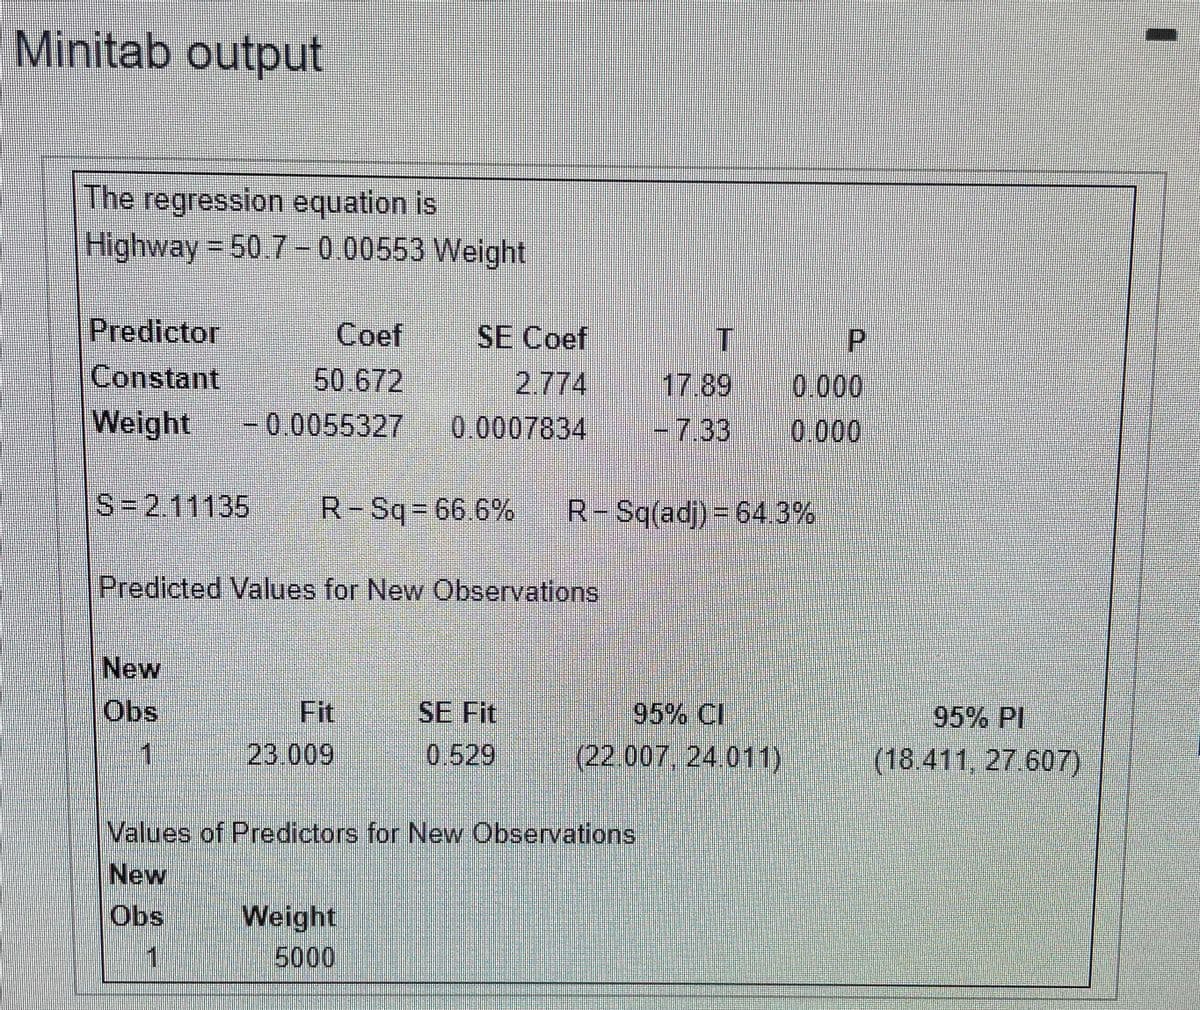
The Minitab output shown below was obtained by using paired data consisting of weights (in lb) of 32 cars and their highway fuel consumption amounts (in mi/gal). Along with the paired sample data, Minitab was also given a car weight of 5000 lb to be used for predicting the highway fuel consumption amount. Use the information provided in the display to determine the value of the linear correlation coefficient . (Be careful to correctly identify the sign of the correlation coefficient.) Given that there are 32 pairs of data, is there sufficient evidence to support a claim of linear correlation between the weights of cars and their highway fuel consumption amounts?
( Minitab output attached)
The linear correlation coefficient is___________.
(Round to three decimal places as needed.)
Is there sufficient evidence to support a claim of linear correlation?
A. No
B. Yes
Transcribed Image Text:Minitab output
The regression equation is
Highway = 50.7 - 0.00553 Weight
Predictor
Constant
Weight
Coef
SE Coef
2.774
0.0007834
P
50.672
17.89
0.000
-0.0055327
7.33
0.000
S-2.11135
R-Sq 66 6%
R-Sq(adj)= 64.3%
Predicted Values for New Observations
New
Obs
Fit
SE Fit
95% CI
95% PI
(18.411, 27.607)
11
23.009
0.529
(22.007, 24.011)
Values of Predictors for New Observations
New
Obs
Weight
5000
Expert Solution
This question has been solved!
Explore an expertly crafted, step-by-step solution for a thorough understanding of key concepts.

This is a popular solution!

Trending now
This is a popular solution!

Step by step
Solved in 3 steps

Recommended textbooks for you
Glencoe Algebra 1, Student Edition, 9780079039897…
Algebra
ISBN:
9780079039897
Author:
Carter
Publisher:
McGraw Hill

College Algebra
Algebra
ISBN:
9781305115545
Author:
James Stewart, Lothar Redlin, Saleem Watson
Publisher:
Cengage Learning

Functions and Change: A Modeling Approach to Coll…
Algebra
ISBN:
9781337111348
Author:
Bruce Crauder, Benny Evans, Alan Noell
Publisher:
Cengage Learning
Glencoe Algebra 1, Student Edition, 9780079039897…
Algebra
ISBN:
9780079039897
Author:
Carter
Publisher:
McGraw Hill
College Algebra
Algebra
ISBN:
9781305115545
Author:
James Stewart, Lothar Redlin, Saleem Watson
Publisher:
Cengage Learning
Functions and Change: A Modeling Approach to Coll…
Algebra
ISBN:
9781337111348
Author:
Bruce Crauder, Benny Evans, Alan Noell
Publisher:
Cengage Learning

Algebra and Trigonometry (MindTap Course List)
Algebra
ISBN:
9781305071742
Author:
James Stewart, Lothar Redlin, Saleem Watson
Publisher:
Cengage Learning