The following table represents the number of hours spent gaming the week before an exam versus the Score on that exam. Hours gaming: 1 3 6 7 9 12 Exam Score: 83 74 62 49 44 35 Part A: Identify Explanatory and Response variables. Part B: Determine the equation of the LSRL. Part C: Find and interpret the correlation coefficient.
The following table represents the number of hours spent gaming the week before an exam versus the Score on that exam. Hours gaming: 1 3 6 7 9 12 Exam Score: 83 74 62 49 44 35 Part A: Identify Explanatory and Response variables. Part B: Determine the equation of the LSRL. Part C: Find and interpret the correlation coefficient.

MATLAB: An Introduction with Applications
6th Edition
ISBN:9781119256830
Author:Amos Gilat
Publisher:Amos Gilat
Chapter1: Starting With Matlab
Section: Chapter Questions
Problem 1P

Related questions
Question
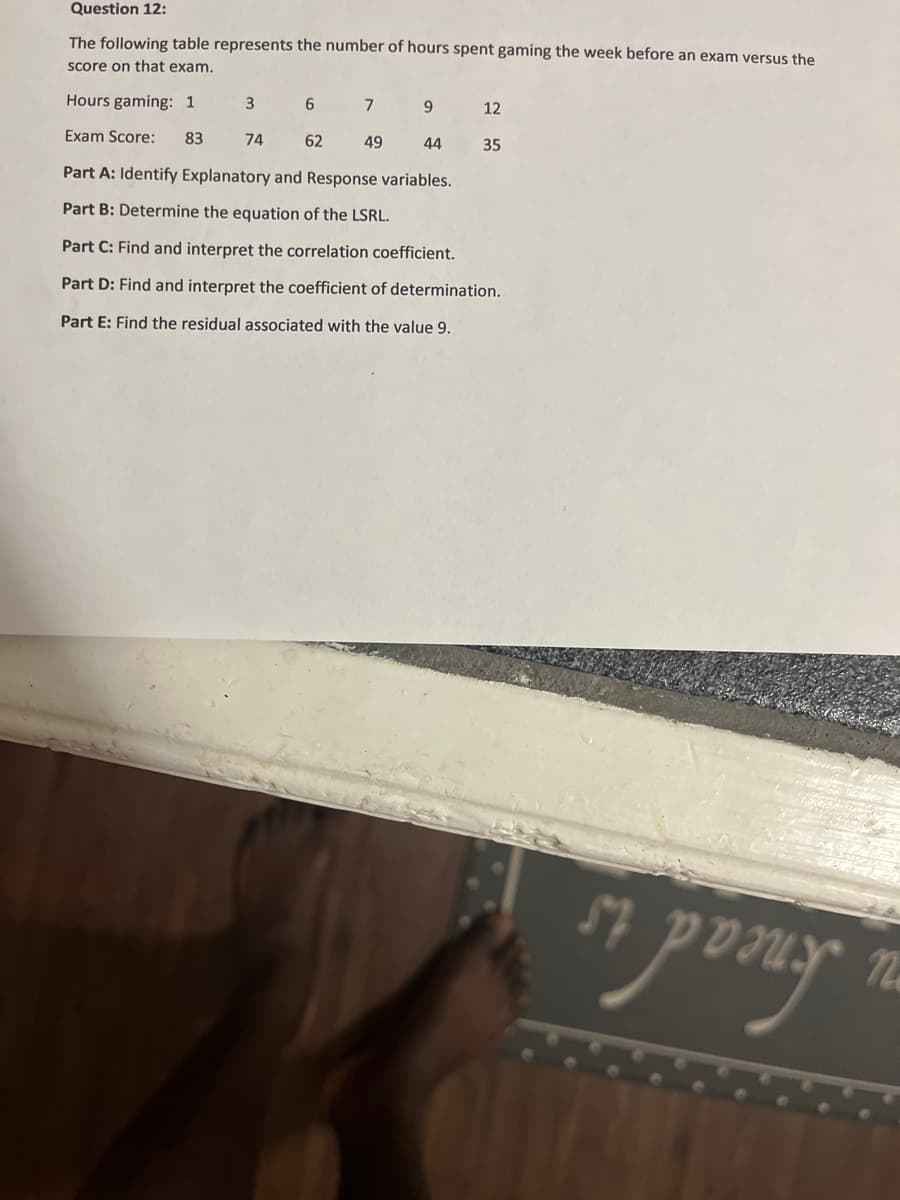
Transcribed Image Text:Question 12:
The following table represents the number of hours spent gaming the week before an exam versus the
Score on that exam.
Hours gaming: 1
3
12
Exam Score:
83
74
62
49
44
35
Part A: Identify Explanatory and Response variables.
Part B: Determine the equation of the LSRL.
Part C: Find and interpret the correlation coefficient.
Part D: Find and interpret the coefficient of determination.
Part E: Find the residual associated with the value 9.
U knead
Expert Solution
This question has been solved!
Explore an expertly crafted, step-by-step solution for a thorough understanding of key concepts.

Step by step
Solved in 4 steps

Recommended textbooks for you
MATLAB: An Introduction with Applications
Statistics
ISBN:
9781119256830
Author:
Amos Gilat
Publisher:
John Wiley & Sons Inc

Probability and Statistics for Engineering and th…
Statistics
ISBN:
9781305251809
Author:
Jay L. Devore
Publisher:
Cengage Learning

Statistics for The Behavioral Sciences (MindTap C…
Statistics
ISBN:
9781305504912
Author:
Frederick J Gravetter, Larry B. Wallnau
Publisher:
Cengage Learning
MATLAB: An Introduction with Applications
Statistics
ISBN:
9781119256830
Author:
Amos Gilat
Publisher:
John Wiley & Sons Inc
Probability and Statistics for Engineering and th…
Statistics
ISBN:
9781305251809
Author:
Jay L. Devore
Publisher:
Cengage Learning
Statistics for The Behavioral Sciences (MindTap C…
Statistics
ISBN:
9781305504912
Author:
Frederick J Gravetter, Larry B. Wallnau
Publisher:
Cengage Learning

Elementary Statistics: Picturing the World (7th E…
Statistics
ISBN:
9780134683416
Author:
Ron Larson, Betsy Farber
Publisher:
PEARSON

The Basic Practice of Statistics
Statistics
ISBN:
9781319042578
Author:
David S. Moore, William I. Notz, Michael A. Fligner
Publisher:
W. H. Freeman

Introduction to the Practice of Statistics
Statistics
ISBN:
9781319013387
Author:
David S. Moore, George P. McCabe, Bruce A. Craig
Publisher:
W. H. Freeman