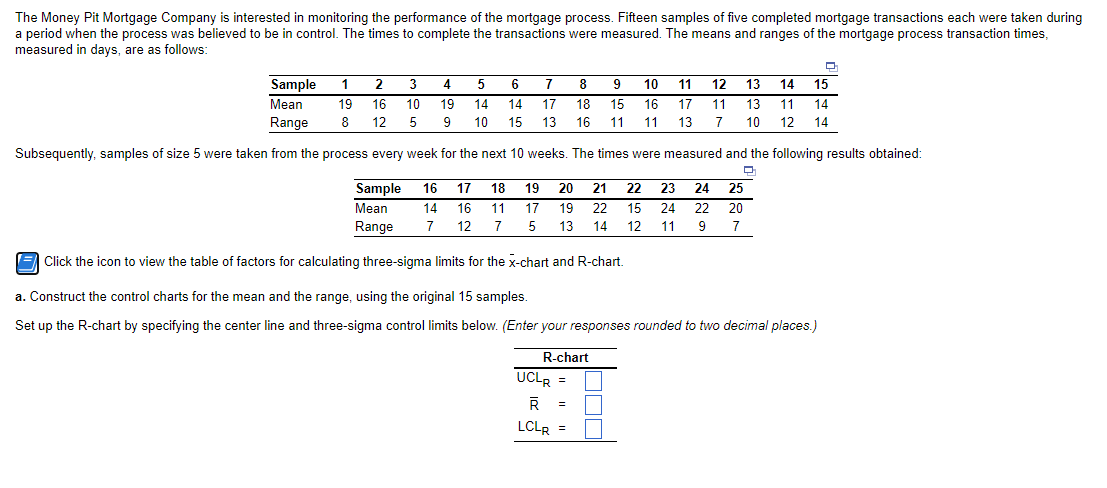
The Money Pit Mortgage Company is interested in monitoring the performance of the mortgage process. Fifteen samples of five completed mortgage transactions each were taken during a period when the process was believed to be in control. The times to complete the transactions were measured. The means and ranges of the mortgage process transaction times, measured in days, are as follows: Sample 1 2 3 4 5 7 8 9 10 11 12 13 14 15 Mean 19 16 10 19 14 14 17 18 15 16 17 11 13 11 14 Range 8 12 9 10 15 13 16 11 11 13 7 10 12 14 Subsequently, samples of size 5 were taken from the process every week for the next 10 weeks. The times were measured and the following results obtained: 21 23 24 25 Sample Mean 16 17 18 19 20 22 14 16 11 17 19 22 15 24 22 20 Range 7 12 7 13 14 12 11 9 7 E Click the icon to view the table of factors for calculating three-sigma limits for the x-chart and R-chart. a. Construct the control charts for the mean and the range, using the original 15 samples. Set up the R-chart by specifying the center line and three-sigma control limits below. (Enter your responses rounded to two decimal places.) R-chart UCLR = R LCLR =
The Money Pit Mortgage Company is interested in monitoring the performance of the mortgage process. Fifteen samples of five completed mortgage transactions each were taken during a period when the process was believed to be in control. The times to complete the transactions were measured. The means and ranges of the mortgage process transaction times, measured in days, are as follows: Sample 1 2 3 4 5 7 8 9 10 11 12 13 14 15 Mean 19 16 10 19 14 14 17 18 15 16 17 11 13 11 14 Range 8 12 9 10 15 13 16 11 11 13 7 10 12 14 Subsequently, samples of size 5 were taken from the process every week for the next 10 weeks. The times were measured and the following results obtained: 21 23 24 25 Sample Mean 16 17 18 19 20 22 14 16 11 17 19 22 15 24 22 20 Range 7 12 7 13 14 12 11 9 7 E Click the icon to view the table of factors for calculating three-sigma limits for the x-chart and R-chart. a. Construct the control charts for the mean and the range, using the original 15 samples. Set up the R-chart by specifying the center line and three-sigma control limits below. (Enter your responses rounded to two decimal places.) R-chart UCLR = R LCLR =

College Algebra (MindTap Course List)
12th Edition
ISBN:9781305652231
Author:R. David Gustafson, Jeff Hughes
Publisher:R. David Gustafson, Jeff Hughes
Chapter8: Sequences, Series, And Probability
Section8.7: Probability
Problem 5E: List the sample space of each experiment. Rolling one die and tossing one coin

Related questions
Question
Transcribed Image Text:The Money Pit Mortgage Company is interested in monitoring the performance of the mortgage process. Fifteen samples of five completed mortgage transactions each were taken during
a period when the process was believed to be in control. The times to complete the transactions were measured. The means and ranges of the mortgage process transaction times,
measured in days, are as follows:
Sample
1
2
3
4
5
7
8
9
10
11
12
13
14
15
Mean
19
16
10
19
14
14
17
18
15
16
17
11
13
11
14
Range
8
12
9
10
15
13
16
11
11
13 7
10
12 14
Subsequently, samples of size 5 were taken from the process every week for the next 10 weeks. The times were measured and the following results obtained:
21
23
24 25
Sample
Mean
16
17
18
19
20
22
14
16
11
17
19
22
15
24
22
20
Range
7
12
7
13
14
12
11
9
7
E Click the icon to view the table of factors for calculating three-sigma limits for the x-chart and R-chart.
a. Construct the control charts for the mean and the range, using the original 15 samples.
Set up the R-chart by specifying the center line and three-sigma control limits below. (Enter your responses rounded to two decimal places.)
R-chart
UCLR =
R
LCLR =
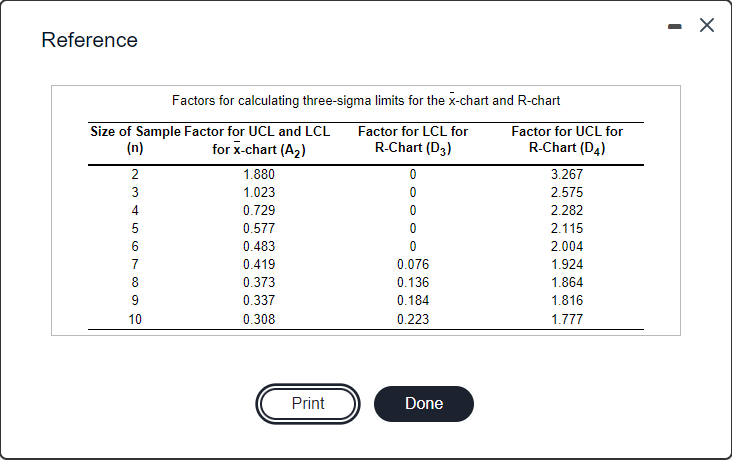
Transcribed Image Text:Reference
Factors for calculating three-sigma limits for the x-chart and R-chart
Size of Sample Factor for UCL and LCL
(n)
Factor for LCL for
R-Chart (D3)
Factor for UCL for
for x-chart (A2)
R-Chart (D4)
2
1.880
3.267
1.023
2.575
4
0.729
2.282
0.577
2.115
6
0.483
2.004
7
0.419
0.076
1.924
8
0.373
0.136
1.864
9
0.337
0.184
1.816
10
0.308
0.223
1.777
Print
Done
Expert Solution
This question has been solved!
Explore an expertly crafted, step-by-step solution for a thorough understanding of key concepts.

This is a popular solution!

Trending now
This is a popular solution!

Step by step
Solved in 3 steps with 4 images

Recommended textbooks for you
College Algebra (MindTap Course List)
Algebra
ISBN:
9781305652231
Author:
R. David Gustafson, Jeff Hughes
Publisher:
Cengage Learning

Holt Mcdougal Larson Pre-algebra: Student Edition…
Algebra
ISBN:
9780547587776
Author:
HOLT MCDOUGAL
Publisher:
HOLT MCDOUGAL

Glencoe Algebra 1, Student Edition, 9780079039897…
Algebra
ISBN:
9780079039897
Author:
Carter
Publisher:
McGraw Hill
College Algebra (MindTap Course List)
Algebra
ISBN:
9781305652231
Author:
R. David Gustafson, Jeff Hughes
Publisher:
Cengage Learning
Holt Mcdougal Larson Pre-algebra: Student Edition…
Algebra
ISBN:
9780547587776
Author:
HOLT MCDOUGAL
Publisher:
HOLT MCDOUGAL
Glencoe Algebra 1, Student Edition, 9780079039897…
Algebra
ISBN:
9780079039897
Author:
Carter
Publisher:
McGraw Hill
