The MTI Enterprise has a total of 300 employees in its two manufacturing location and the headquarters office. Five years ago, a study showed the average commutin distance to work for MTI employees was 6.2 miles with a standard deviation of 3 mile Recently, a follow-up study based on a random sample of 100 employees indicate an average travel distance of 5.9 miles. (i) Assuming that the mean and standard deviation of the original study holk calculate the probability of obtaining a sample mean of 5.9 miles or less? (ii) Based on probability in (i), infer whether the average travel distance may hav changed? (iii) A second random sample of 40 was selected. This sample produced a mea travel distance of 5.9 miles. If the mean for all employees is 6.2 miles and th standard deviation is 3 miles, calculate the probability of observing a sampl mean of 5.9 miles or less?
The MTI Enterprise has a total of 300 employees in its two manufacturing location and the headquarters office. Five years ago, a study showed the average commutin distance to work for MTI employees was 6.2 miles with a standard deviation of 3 mile Recently, a follow-up study based on a random sample of 100 employees indicate an average travel distance of 5.9 miles. (i) Assuming that the mean and standard deviation of the original study holk calculate the probability of obtaining a sample mean of 5.9 miles or less? (ii) Based on probability in (i), infer whether the average travel distance may hav changed? (iii) A second random sample of 40 was selected. This sample produced a mea travel distance of 5.9 miles. If the mean for all employees is 6.2 miles and th standard deviation is 3 miles, calculate the probability of observing a sampl mean of 5.9 miles or less?

MATLAB: An Introduction with Applications
6th Edition
ISBN:9781119256830
Author:Amos Gilat
Publisher:Amos Gilat
Chapter1: Starting With Matlab
Section: Chapter Questions
Problem 1P

Related questions
Topic Video
Question
Transcribed Image Text:Question 1
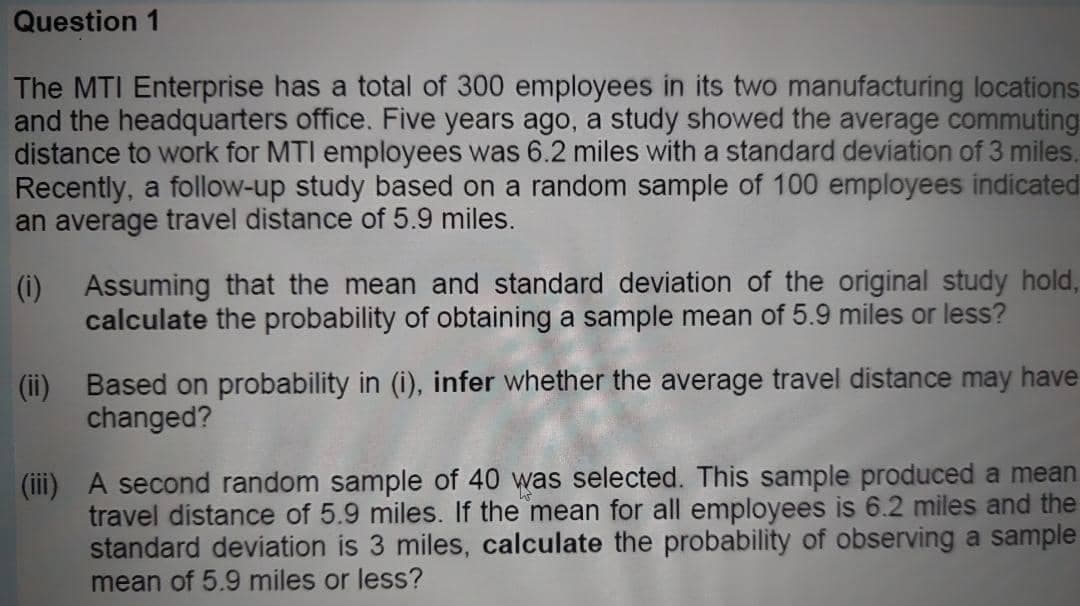
The MTI Enterprise has a total of 300 employees in its two manufacturing locations
and the headquarters office. Five years ago, a study showed the average commuting
distance to work for MTI employees was 6.2 miles with a standard deviation of 3 miles.
Recently, a follow-up study based on a random sample of 100 employees indicated
an average travel distance of 5.9 miles.
(i) Assuming that the mean and standard deviation of the original study hold,
calculate the probability of obtaining a sample mean of 5.9 miles or less?
(ii) Based on probability in (i), infer whether the average travel distance may have
changed?
(iii) A second random sample of 40 was selected. This sample produced a mean
travel distance of 5.9 miles. If the mean for all employees is 6.2 miles and the
standard deviation is 3 miles, calculate the probability of observing a sample
mean of 5.9 miles or less?
Expert Solution
This question has been solved!
Explore an expertly crafted, step-by-step solution for a thorough understanding of key concepts.

Step by step
Solved in 2 steps with 2 images

Knowledge Booster


Learn more about
Need a deep-dive on the concept behind this application? Look no further. Learn more about this topic, statistics and related others by exploring similar questions and additional content below.Recommended textbooks for you
MATLAB: An Introduction with Applications
Statistics
ISBN:
9781119256830
Author:
Amos Gilat
Publisher:
John Wiley & Sons Inc

Probability and Statistics for Engineering and th…
Statistics
ISBN:
9781305251809
Author:
Jay L. Devore
Publisher:
Cengage Learning

Statistics for The Behavioral Sciences (MindTap C…
Statistics
ISBN:
9781305504912
Author:
Frederick J Gravetter, Larry B. Wallnau
Publisher:
Cengage Learning
MATLAB: An Introduction with Applications
Statistics
ISBN:
9781119256830
Author:
Amos Gilat
Publisher:
John Wiley & Sons Inc
Probability and Statistics for Engineering and th…
Statistics
ISBN:
9781305251809
Author:
Jay L. Devore
Publisher:
Cengage Learning
Statistics for The Behavioral Sciences (MindTap C…
Statistics
ISBN:
9781305504912
Author:
Frederick J Gravetter, Larry B. Wallnau
Publisher:
Cengage Learning

Elementary Statistics: Picturing the World (7th E…
Statistics
ISBN:
9780134683416
Author:
Ron Larson, Betsy Farber
Publisher:
PEARSON

The Basic Practice of Statistics
Statistics
ISBN:
9781319042578
Author:
David S. Moore, William I. Notz, Michael A. Fligner
Publisher:
W. H. Freeman

Introduction to the Practice of Statistics
Statistics
ISBN:
9781319013387
Author:
David S. Moore, George P. McCabe, Bruce A. Craig
Publisher:
W. H. Freeman