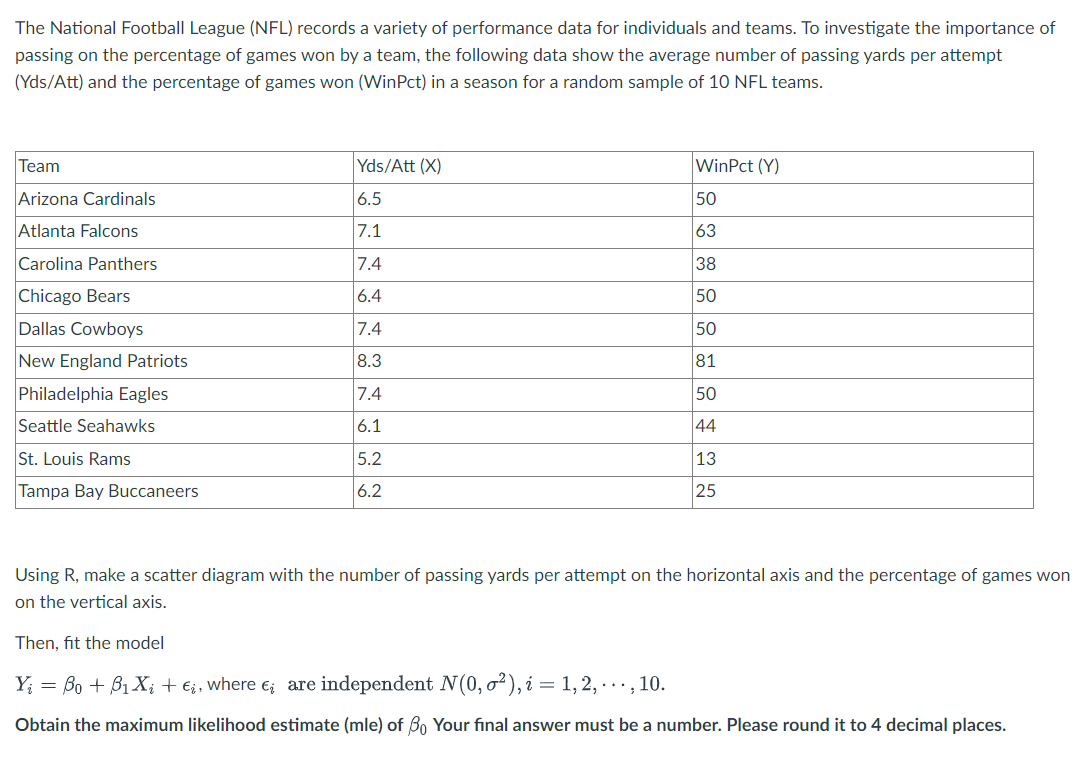
The National Football League (NFL) records a variety of performance data for individuals and teams. To investigate the importance of passing on the percentage of games won by a team, the following data show the average number of passing yards per attempt (Yds/Att) and the percentage of games won (WinPct) in a season for a random sample of 10 NFL teams.
The National Football League (NFL) records a variety of performance data for individuals and teams. To investigate the importance of passing on the percentage of games won by a team, the following data show the average number of passing yards per attempt (Yds/Att) and the percentage of games won (WinPct) in a season for a random sample of 10 NFL teams.

Glencoe Algebra 1, Student Edition, 9780079039897, 0079039898, 2018
18th Edition
ISBN:9780079039897
Author:Carter
Publisher:Carter
Chapter10: Statistics
Section10.4: Distributions Of Data
Problem 19PFA

Related questions
Question
[STATISTICS] How do you solve this?
Transcribed Image Text:The National Football League (NFL) records a variety of performance data for individuals and teams. To investigate the importance of
passing on the percentage of games won by a team, the following data show the average number of passing yards per attempt
(Yds/Att) and the percentage of games won (WinPct) in a season for a random sample of 10 NFL teams.
Team
Arizona Cardinals
Atlanta Falcons
Carolina Panthers
Chicago Bears
Dallas Cowboys
New England Patriots
Philadelphia Eagles
Seattle Seahawks
St. Louis Rams
Tampa Bay Buccaneers
Yds/Att (X)
6.5
7.1
7.4
6.4
7.4
8.3
7.4
6.1
5.2
6.2
WinPct (Y)
50
63
38
50
50
81
50
44
13
25
Using R, make a scatter diagram with the number of passing yards per attempt on the horizontal axis and the percentage of games won
on the vertical axis.
Then, fit the model
Y₁ = Bo + B₁X₁ + ₁, where ; are independent N(0, 2), i = 1, 2, ..., 10.
Obtain the maximum likelihood estimate (mle) of Bo Your final answer must be a number. Please round it to 4 decimal places.
Expert Solution
This question has been solved!
Explore an expertly crafted, step-by-step solution for a thorough understanding of key concepts.

This is a popular solution!

Trending now
This is a popular solution!

Step by step
Solved in 5 steps with 23 images

Recommended textbooks for you
Glencoe Algebra 1, Student Edition, 9780079039897…
Algebra
ISBN:
9780079039897
Author:
Carter
Publisher:
McGraw Hill

College Algebra (MindTap Course List)
Algebra
ISBN:
9781305652231
Author:
R. David Gustafson, Jeff Hughes
Publisher:
Cengage Learning
Glencoe Algebra 1, Student Edition, 9780079039897…
Algebra
ISBN:
9780079039897
Author:
Carter
Publisher:
McGraw Hill
College Algebra (MindTap Course List)
Algebra
ISBN:
9781305652231
Author:
R. David Gustafson, Jeff Hughes
Publisher:
Cengage Learning