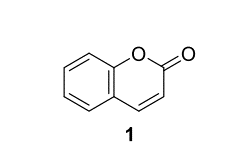
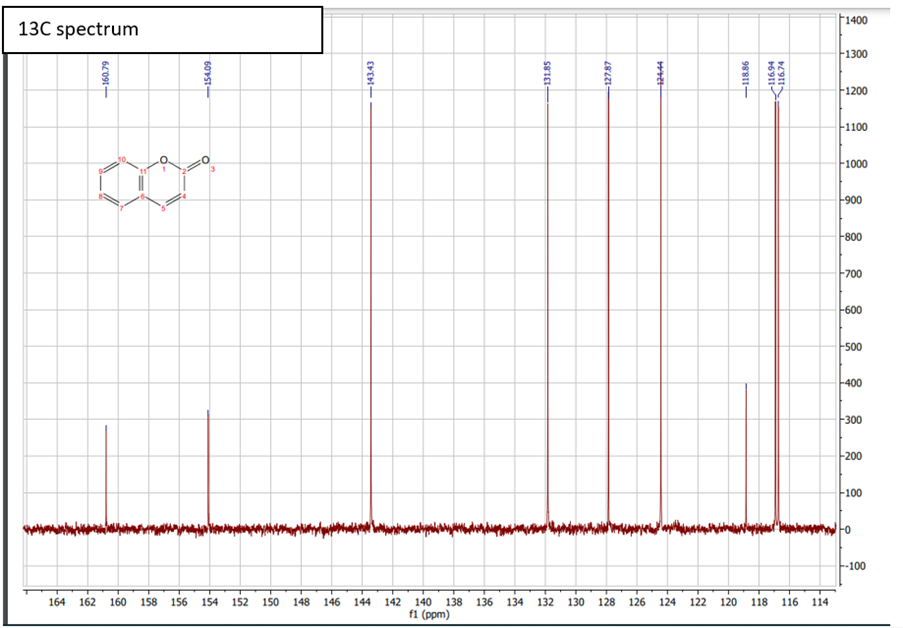
The NMR spectra for compound 1 were acquired in a 7.5 mg / 0.6 mL solution of CDCl3 . The 1H and 13C peaks are also listed below. Provide a full analysis of the NMR spectra for compound 1. correct assignment of NMR spectra of both 13C spectra. correct rationalisation of 13C spectrum 1H NMR (400 MHz, CDCl3) δ 7.73 (d, J = 9.5 Hz, 1H), 7.56 (ddd, J = 8.5, 7.5, 1.6 Hz, 1H), 7.51 (dd, J = 7.5, 1.6 Hz, 1H), 7.36 (d, J = 8.5 Hz, 1H), 7.30 (dd, J = 8.5, 7.5 Hz, 1H), 6.45 (d, J = 9.5 Hz, 1H). 13C NMR (101 MHz, CDCl3) δ 160.79, 154.09, 143.43, 131.85, 127.87, 124.44, 118.86, 116.94, 116.74. Note: There are two carbon peaks in the 13C spectrum that are so close together that they are not differentiable at the resolution in this experiment. you should be able to assign these peaks to one of two carbon atoms in 1.

The NMR spectra for compound 1 were acquired in a 7.5 mg / 0.6 mL solution of
CDCl3 . The 1H and 13C peaks are also listed
below. Provide a full analysis of the NMR spectra for compound 1.
correct assignment of NMR spectra of both 13C spectra.
correct rationalisation of 13C spectrum
1H NMR (400 MHz, CDCl3) δ 7.73 (d, J = 9.5 Hz, 1H), 7.56 (ddd, J = 8.5, 7.5, 1.6 Hz, 1H),
7.51 (dd, J = 7.5, 1.6 Hz, 1H), 7.36 (d, J = 8.5 Hz, 1H), 7.30 (dd, J = 8.5, 7.5 Hz, 1H), 6.45
(d, J = 9.5 Hz, 1H).
13C NMR (101 MHz, CDCl3) δ 160.79, 154.09, 143.43, 131.85, 127.87, 124.44, 118.86,
116.94, 116.74.
Note: There are two carbon peaks in the 13C spectrum that are so close together that they are not differentiable at the resolution in this experiment. you should be able to assign these peaks to one of two carbon atoms in 1.

Step by step
Solved in 2 steps with 3 images
