The normal quantile plot shown to the right represents duration times (in seconds) of eruptions of a certain geyser from the accompanying data set. Examine the normal quantile plot and determine whether it depicts sample data from a population with a normal distribution. Data Table Duration (sec) 252 250 215 225 128 245 263 240 247 269 292 243 272 110 240 261 233 252 255 252 257 245 236 234 274 282 178 255 268 252 288 256 271 250 239 274 251 268 255 237
The normal quantile plot shown to the right represents duration times (in seconds) of eruptions of a certain geyser from the accompanying data set. Examine the normal quantile plot and determine whether it depicts sample data from a population with a normal distribution. Data Table Duration (sec) 252 250 215 225 128 245 263 240 247 269 292 243 272 110 240 261 233 252 255 252 257 245 236 234 274 282 178 255 268 252 288 256 271 250 239 274 251 268 255 237

Glencoe Algebra 1, Student Edition, 9780079039897, 0079039898, 2018
18th Edition
ISBN:9780079039897
Author:Carter
Publisher:Carter
Chapter10: Statistics
Section10.3: Measures Of Spread
Problem 26PFA

Related questions
Question
The normal quantile plot shown to the right represents duration times (in seconds) of eruptions of a certain geyser from the accompanying data set. Examine the normal quantile plot and determine whether it depicts sample data from a population with a normal distribution .
Data Table
|
Duration (sec)
|
|||
|
252
|
|
250
|
|
|
215
|
|
225
|
|
|
128
|
|
245
|
|
|
263
|
|
240
|
|
|
247
|
|
269
|
|
|
292
|
|
243
|
|
|
272
|
|
110
|
|
|
240
|
|
261
|
|
|
233
|
|
252
|
|
|
255
|
|
252
|
|
|
257
|
|
245
|
|
|
236
|
|
234
|
|
|
274
|
|
282
|
|
|
178
|
|
255
|
|
|
268
|
|
252
|
|
|
288
|
|
256
|
|
|
271
|
|
250
|
|
|
239
|
|
274
|
|
|
251
|
|
268
|
|
|
255
|
|
237
|
|
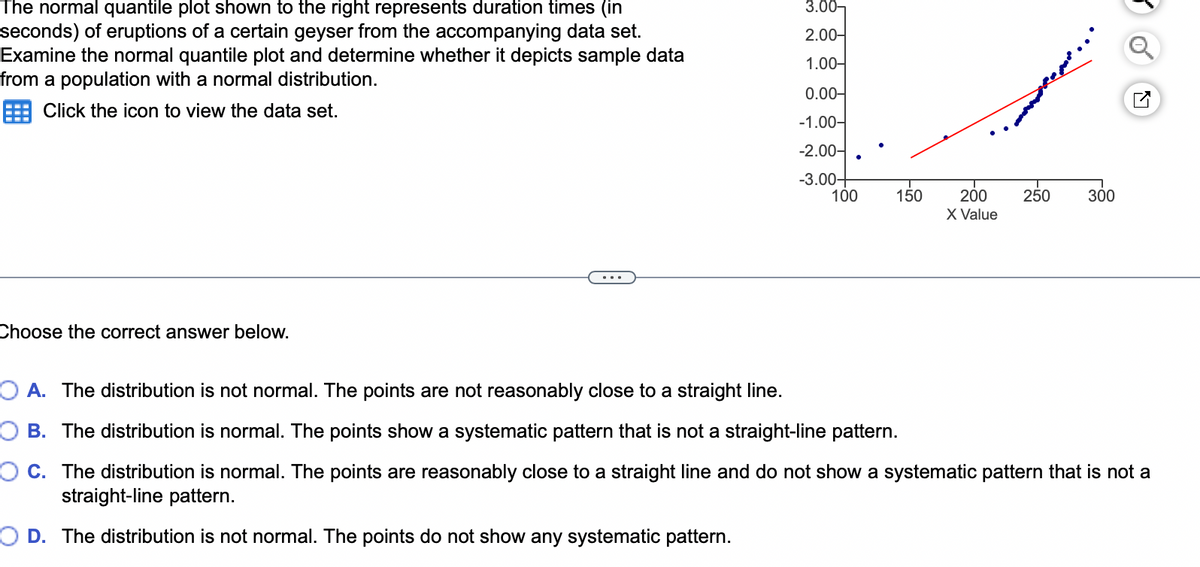
Transcribed Image Text:The normal quantile plot shown to the right represents duration times (in
seconds) of eruptions of a certain geyser from the accompanying data set.
Examine the normal quantile plot and determine whether it depicts sample data
from a population with a normal distribution.
Click the icon to view the data set.
Choose the correct answer below.
3.00-
2.00-
1.00-
0.00-
-1.00-
-2.00-
-3.00+
100
150
200
X Value
250
300
OA. The distribution is not normal. The points are not reasonably close to a straight line.
OB. The distribution is normal. The points show a systematic pattern that is not a straight-line pattern.
OC. The distribution is normal. The points are reasonably close to a straight line and do not show a systematic pattern that is not a
straight-line pattern.
OD. The distribution is not normal. The points do not show any systematic pattern.
Expert Solution
This question has been solved!
Explore an expertly crafted, step-by-step solution for a thorough understanding of key concepts.

This is a popular solution!

Trending now
This is a popular solution!

Step by step
Solved in 3 steps

Recommended textbooks for you
Glencoe Algebra 1, Student Edition, 9780079039897…
Algebra
ISBN:
9780079039897
Author:
Carter
Publisher:
McGraw Hill
Glencoe Algebra 1, Student Edition, 9780079039897…
Algebra
ISBN:
9780079039897
Author:
Carter
Publisher:
McGraw Hill