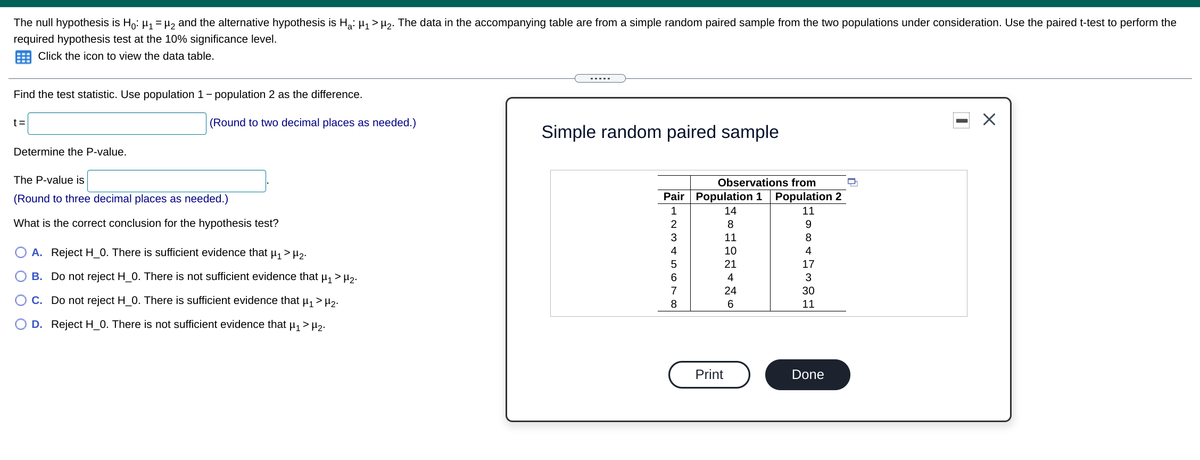
The null hypothesis is Ho: H1 = 2 and the alternative hypothesis is H: H > H2. The data in the accompanying table are from a simple random paired sample from the two populations under consideration. Use the paired t-test to perform the required hypothesis test at the 10% significance level. E Click the icon to view the data table. Find the test statistic. Use population 1- population 2 as the difference. t= (Round to two decimal places as needed.) Simple random paired sample Determine the P-value. The P-value is Observations from Pair Population 1 Population 2 (Round to three decimal places as needed.) 14 11 What is the correct conclusion for the hypothesis test? 2 8. 9. 3 11 8. O A. Reject H_0. There is sufficient evidence that u, > H2. 10 4 4 21 17 O B. Do not reject H_0. There is not sufficient evidence that u, >H2- 6. 4 3 7. 24 30 OC. Do not reject H 0. There is sufficient evidence that u, >H2. 8. 6. 11 O D. Reject H 0. There is not sufficient evidence that u, >H2- Print Done
The null hypothesis is Ho: H1 = 2 and the alternative hypothesis is H: H > H2. The data in the accompanying table are from a simple random paired sample from the two populations under consideration. Use the paired t-test to perform the required hypothesis test at the 10% significance level. E Click the icon to view the data table. Find the test statistic. Use population 1- population 2 as the difference. t= (Round to two decimal places as needed.) Simple random paired sample Determine the P-value. The P-value is Observations from Pair Population 1 Population 2 (Round to three decimal places as needed.) 14 11 What is the correct conclusion for the hypothesis test? 2 8. 9. 3 11 8. O A. Reject H_0. There is sufficient evidence that u, > H2. 10 4 4 21 17 O B. Do not reject H_0. There is not sufficient evidence that u, >H2- 6. 4 3 7. 24 30 OC. Do not reject H 0. There is sufficient evidence that u, >H2. 8. 6. 11 O D. Reject H 0. There is not sufficient evidence that u, >H2- Print Done

Glencoe Algebra 1, Student Edition, 9780079039897, 0079039898, 2018
18th Edition
ISBN:9780079039897
Author:Carter
Publisher:Carter
Chapter4: Equations Of Linear Functions
Section: Chapter Questions
Problem 8SGR

Related questions
Question
Transcribed Image Text:The null hypothesis is Ho: H1 = H, and the alternative hypothesis is H,: µ, > H2. The data in the accompanying table are from a simple random paired sample from the two populations under consideration. Use the paired t-test to perform the
required hypothesis test at the 10% significance level.
Click the icon to view the data table.
.....
Find the test statistic. Use population 1- population 2 as the difference.
t=
(Round to two decimal places as needed.)
Simple random paired sample
Determine the P-value.
The P-value is
Observations from
(Round to three decimal places as needed.)
Pair Population 1 Population 2
1
14
11
What is the correct conclusion for the hypothesis test?
8
9.
3
11
8
O A. Reject H_0. There is sufficient evidence that u, > H,.
4
10
4
21
17
O B. Do not reject H_0. There is not sufficient evidence that u, > H,.
4
7
24
30
O C. Do not reject H_0. There is sufficient evidence that u, > H2.
8.
11
D. Reject H_0. There is not sufficient evidence that u, > µ,.
Print
Done
Expert Solution
This question has been solved!
Explore an expertly crafted, step-by-step solution for a thorough understanding of key concepts.

This is a popular solution!

Trending now
This is a popular solution!

Step by step
Solved in 4 steps with 3 images

Recommended textbooks for you
Glencoe Algebra 1, Student Edition, 9780079039897…
Algebra
ISBN:
9780079039897
Author:
Carter
Publisher:
McGraw Hill

College Algebra (MindTap Course List)
Algebra
ISBN:
9781305652231
Author:
R. David Gustafson, Jeff Hughes
Publisher:
Cengage Learning
Glencoe Algebra 1, Student Edition, 9780079039897…
Algebra
ISBN:
9780079039897
Author:
Carter
Publisher:
McGraw Hill
College Algebra (MindTap Course List)
Algebra
ISBN:
9781305652231
Author:
R. David Gustafson, Jeff Hughes
Publisher:
Cengage Learning