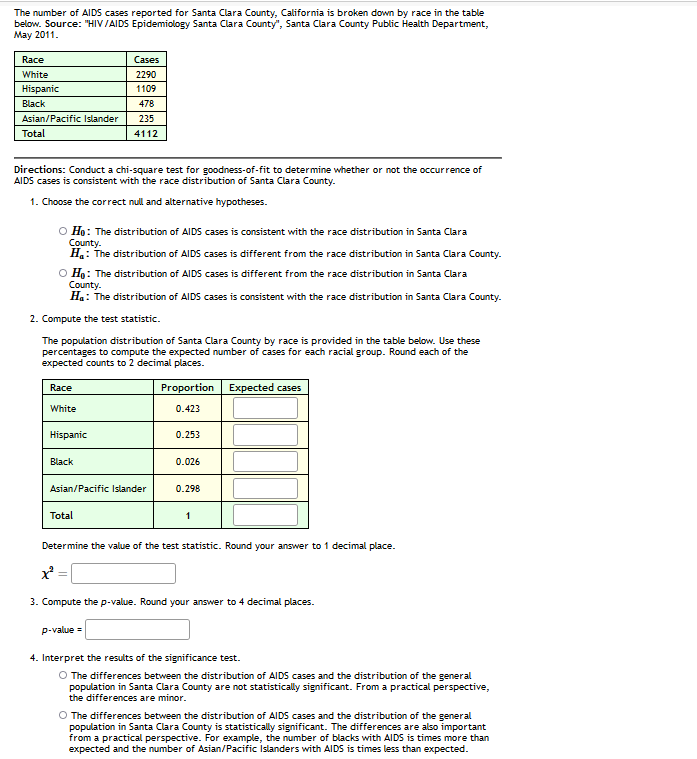
The number of AIDS cases reported for Santa Clara County, California is broken down by race in the table below. Source: "HIV /AIDS Epidemiology Santa Clara County", Santa Clara County Public Health Department, May 2011. Race Cases White 2290 Hispanic 1109 Black 478 Asian/Pacific Islander 235 Total 4112 Directions: Conduct a chi-square test for goodness-of-fit to determine whether or not the occurrence of AIDS cases is consistent with the race distribution of Santa Clara County. 1. Choose the correct null and alternative hypotheses. O Ho: The distribution of AIDS cases is consistent with the race distribution in Santa Clara County. H.: The distribution of AIDS cases is different from the race distribution in Santa Clara County. O H: The distribution of AIDS cases is different from the race distribution in Santa Clara County. Ha: The distribution of AIDS cases is consistent with the race distribution in Santa Clara County. 2. Compute the test statistic. The population distribution of Santa Clara County by race is provided in the table below. Use these percentages to compute the expected number of cases for each racial group. Round each of the expected counts to 2 decimal places. Race Proportion Expected cases White 0.423 Hispanic 0.253 Black 0.026 Asian/Pacific Islander 0.298 Total 1 Determine the value of the test statistic. Round your answer to 1 decimal place. 3. Compute the p-value. Round your answer to 4 decimal places. p-value = 4. Interpret the results of the significance test. O The differences between the distribution of AlIDS cases and the distribution of the general population in Santa Clara County are not statistically significant. From a practical perspective, the differences are minor. O The differences between the distribution of AlIDS cases and the distribution of the general population in Santa Clara County is statistically significant. The differences are also important from a practical perspective. For example, the number of blacks with AIDS is times more than expected and the number of Asian/Pacific Islanders with AIDS is times less than expected.
The number of AIDS cases reported for Santa Clara County, California is broken down by race in the table below. Source: "HIV /AIDS Epidemiology Santa Clara County", Santa Clara County Public Health Department, May 2011. Race Cases White 2290 Hispanic 1109 Black 478 Asian/Pacific Islander 235 Total 4112 Directions: Conduct a chi-square test for goodness-of-fit to determine whether or not the occurrence of AIDS cases is consistent with the race distribution of Santa Clara County. 1. Choose the correct null and alternative hypotheses. O Ho: The distribution of AIDS cases is consistent with the race distribution in Santa Clara County. H.: The distribution of AIDS cases is different from the race distribution in Santa Clara County. O H: The distribution of AIDS cases is different from the race distribution in Santa Clara County. Ha: The distribution of AIDS cases is consistent with the race distribution in Santa Clara County. 2. Compute the test statistic. The population distribution of Santa Clara County by race is provided in the table below. Use these percentages to compute the expected number of cases for each racial group. Round each of the expected counts to 2 decimal places. Race Proportion Expected cases White 0.423 Hispanic 0.253 Black 0.026 Asian/Pacific Islander 0.298 Total 1 Determine the value of the test statistic. Round your answer to 1 decimal place. 3. Compute the p-value. Round your answer to 4 decimal places. p-value = 4. Interpret the results of the significance test. O The differences between the distribution of AlIDS cases and the distribution of the general population in Santa Clara County are not statistically significant. From a practical perspective, the differences are minor. O The differences between the distribution of AlIDS cases and the distribution of the general population in Santa Clara County is statistically significant. The differences are also important from a practical perspective. For example, the number of blacks with AIDS is times more than expected and the number of Asian/Pacific Islanders with AIDS is times less than expected.

Glencoe Algebra 1, Student Edition, 9780079039897, 0079039898, 2018
18th Edition
ISBN:9780079039897
Author:Carter
Publisher:Carter
Chapter10: Statistics
Section10.6: Summarizing Categorical Data
Problem 30PPS

Related questions
Question
Transcribed Image Text:The number of AIDS cases reported for Santa Clara County, California is broken down by race in the table
below. Source: "HIV/AIDS Epidemiology Santa Clara County", Santa Clara County Public Health Department,
May 2011.
Race
Cases
White
2290
Hispanic
1109
Black
478
Asian/Pacific Islander
235
Total
4112
Directions: Conduct a chi-square test for goodness-of-fit to determine whether or not the occurrence of
AIDS cases is consistent with the race distribution of Santa Clara County.
1. Choose the correct null and alternative hypotheses.
O Ho: The distribution of AIDS cases is consistent with the race distribution in
County.
H.: The distribution of AIDS cases is different from the race distribution in Santa Clara County.
Clara
O Ho: The distribution of AIDS cases is different from the race distribution in Santa Clara
County.
Ha: The distribution of AIDS cases is consistent with the race distribution in Santa Clara County.
2. Compute the test statistic.
The population distribution of Santa Clara County by race is provided in the table below. Use these
percentages to compute the expected number of cases for each racial group. Round each of the
expected counts to 2 decimal places.
Proportion Expected cases
Race
White
0.423
Hispanic
0.253
Black
0.026
Asian/Pacific Islander
0.298
Total
Determine the value of the test statistic. Round your answer to 1 decimal place.
3. Compute the p-value. Round your answer to 4 decimal places.
p-value =
4. Interpret the results of the significance test.
O The differences between the distribution of AlIDS cases and the distribution of the general
population in Santa Clara County are not statistically significant. From a practical perspective,
the differences are minor.
O The differences between the distribution of AlIDS cases and the distribution of the general
population in Santa Clara County is statistically significant. The differences are also important
from a practical perspective. For example, the number of blacks with AIDS is times more than
expected and the number of Asian/Pacific Islanders with AIDS is times less than expected.
Expert Solution
This question has been solved!
Explore an expertly crafted, step-by-step solution for a thorough understanding of key concepts.

This is a popular solution!

Trending now
This is a popular solution!

Step by step
Solved in 2 steps

Knowledge Booster


Learn more about
Need a deep-dive on the concept behind this application? Look no further. Learn more about this topic, probability and related others by exploring similar questions and additional content below.Recommended textbooks for you
Glencoe Algebra 1, Student Edition, 9780079039897…
Algebra
ISBN:
9780079039897
Author:
Carter
Publisher:
McGraw Hill

College Algebra (MindTap Course List)
Algebra
ISBN:
9781305652231
Author:
R. David Gustafson, Jeff Hughes
Publisher:
Cengage Learning

Glencoe Algebra 1, Student Edition, 9780079039897…
Algebra
ISBN:
9780079039897
Author:
Carter
Publisher:
McGraw Hill
College Algebra (MindTap Course List)
Algebra
ISBN:
9781305652231
Author:
R. David Gustafson, Jeff Hughes
Publisher:
Cengage Learning